The native token of the Layer 2 network Arbitrum (ARB) shows clear signs of completing a transition phase. After weeks of persistent selling pressure since May, price action on the ARB/USDT pair stopped printing lower lows to build a solid Change of Character structure. The movement stems from a deliberate injection of institutional liquidity at extreme discount zones, challenging key resistance at $0.1013 and projecting new technical targets toward $0.1495.
Strategic Transition: From Downtrend to Accumulation Range
The altcoin market is undergoing a structural recomposition in its long-term setups, and ARB is leading this capital rotation. Price left behind the descending channel dynamic that held it down from local highs, settling atop a high-order-density structural floor.
The $0.0740 area, which marked all-time lows of previous support, served once again as the core pivot for absorption. This behavior signals the end of the bearish impulse phase and marks the beginning of a trading range between that floor and the upper resistance at $0.1495.
Technical Analysis: Candlestick Narrative and Order Flow
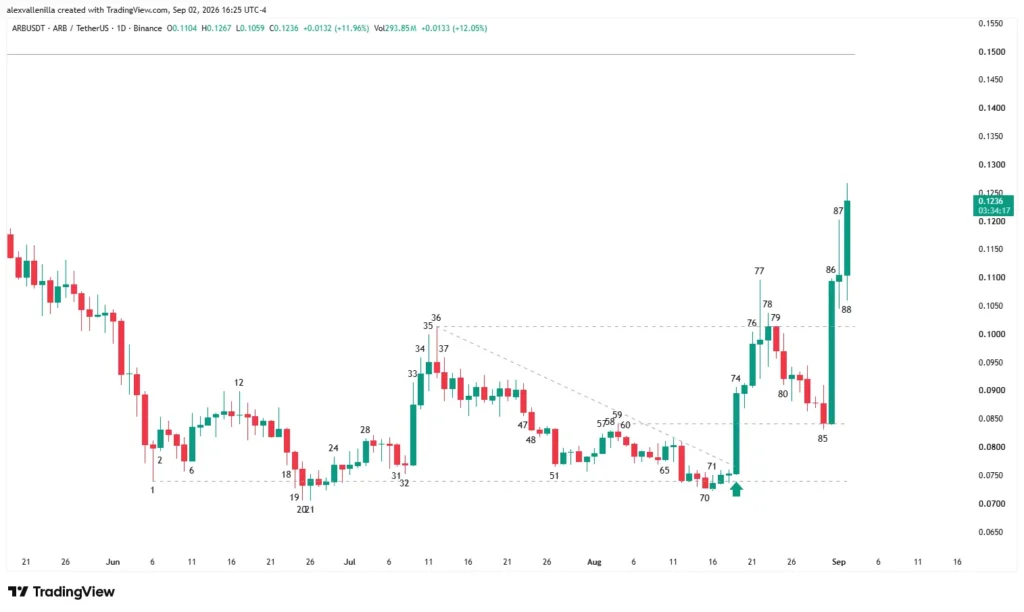
Price action from Bar 70 to Bar 88 provides a textbook lesson in market psychology, showing how institutions sweep sell-side liquidity before launching a bullish push.
The Sell Trap and Trendline Break
Bar 70 marginally undercut historical support at $0.0740. However, the lack of selling follow-through triggered an immediate response:
Bars 71 and 72: Bar 71 acted as a Failed Breakout signal bar. Bar 72 confirmed the level reclaim, validating the defense of the area as a Double Bottom against the Bar 20-21 pivot. This move trapped late short positions (Bear Trap).
Bar 74: A high-conviction Bull Surprise Bar expanded. Featuring a wide range, a close near its high, and a negligible upper wick, this candle broke the 38-bar downtrend line (which connected the Bar 36 high to the Bar 59 zone) and absorbed resistance at $0.0841. The move left a Measuring Gap that reflects a significant imbalance between supply and demand.
Resistance Absorption and Polarity Test
Approaching the key $0.1013 level:
Bars 76 and 77: Bar 76 extended the impulse, but Bar 77 printed a wide-range Doji upon testing the Bar 36 resistance ($0.1013) for the first time. The volatility highlighted profit-taking and interaction with resting supply.
Bars 78 to 80: Bars 78 and 79 built an Inside Bar, consolidating at the highs. Bar 80 triggered a High 2 Flag Failure for this micro bull flag, leading into a structured Two-Legged Pullback.
Bar 85: Bar 85 acted as the Signal Bar for the pullback. It retested the former Bar 59 resistance ($0.0841) with pinpoint precision, turning it into key support under the polarity principle. Declining volume on the red bars confirmed that the move was profit-taking rather than massive liquidation.
Breakout Confirmation and Current Momentum
Bar 86: Acted as the institutional Entry Bar. This strong-bodied Bull Trend Bar decisively broke the $0.1013 level, confirming a Higher Low relative to Bar 70.
Bars 87 and 88 (Current Bar): Bar 87 set new highs before showing an upper wick due to intraday profit-taking. Bar 88 reaffirms Bull Follow-Through, aiming to consolidate closes above $0.1013 to turn former resistance into structural support.
Trading Scenarios and Price Projection
Order flow dynamics outline three clear paths for the coming days:
Primary Bullish Scenario (High Probability): Consolidating closes above $0.1013 opens a direct route toward major resistance at $0.1495. A Measured Move projection calculated from the 85-87 impulse leg sets an intermediate technical target in the $0.1320 – $0.1380 range.
Consolidation Scenario (Secondary): Given the extended nature of Bars 87 and 88, price may execute a retest pullback toward the $0.1013 zone. Successfully defending this mark will confirm the definitive flip in polarity.
Technical Invalidation: A daily close penetrating back below $0.0841 invalidates the Higher Low structure, pushing price back into the tight range between $0.0740 and $0.1013.
Turning Point in Market Structure
Price action in ARB/USDT shifted from a defensive phase into an expansion phase backed by buying volume. Establishing a clear Higher Low at Bar 85, backed by the Bar 86 breakout through $0.1013 resistance, invalidates the short-term bearish narrative. If volume supports current consolidation, testing the major target at $0.1495 represents the next step in the asset’s technical upside.
Disclaimer: This article is strictly for informational and educational purposes. It does not constitute financial advice, an investment recommendation, or an official securities analysis. Crypto asset markets carry high volatility; perform your own research (DYOR) before making any investment decisions.

Communications Professional. Crypto Enthusiast. Economic Journalist. Bitcoiner & Altcoiner.