The PAXG/USDT pair faces a decisive moment on its daily chart. After reaching a local high and undergoing an aggressive two-legged correction, price action reveals a fierce institutional defense around the $4,330 zone. Driven by liquidity absorption, this technical maneuver will determine over the coming hours whether the asset resumes its path toward $4,760 or gives in to selling pressure to search for deeper support levels.
Market Context: From the Bottom to Euphoria
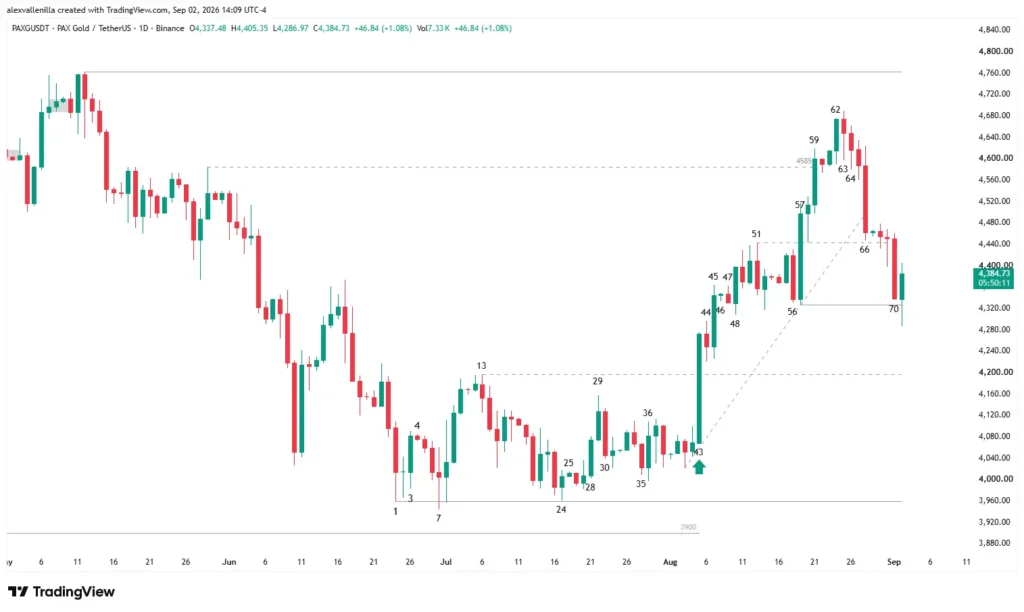
To understand the current move, we need to look at the broader market structure. The daily chart displays a wide trading range established by buyers after halting a prior downtrend. Bulls found solid footing around $3,960 – $4,000 (marked by Bar 43), a level that triggered an impulsive recovery.
From there, buyers orchestrated a strong 25-bar Spike and Channel pattern culminating at Bar 62. During this advance, price smashed through critical intermediate resistance levels, such as $4,200 and $4,585, demonstrating complete demand dominance.
Bar 59 exemplifies this strength: it acted as a wide-range breakout bar that surged past the $4,585 resistance. This move validated bullish intent and opened technical room toward the higher target of $4,760. However, the market rarely moves in a straight line.
Anatomy of the Correction: Breaking Down Price Action
Bar 62 marked the climax of this bullish push. It functioned as an exhaustion bar, completing a second push leg that fell just short of tapping the $4,760 liquidity pool. Upper wicks in this area showed smart money taking profits off the table.
Immediately after, sellers took control. Bar 63 initiated the correction as a bearish signal (High 1 Failure or Bear Surprise). Although buyers tried to defend the dip (leaving a lower wick), the remaining gap to the $4,760 target confirmed a total loss of bullish momentum. After a brief pause at Bar 64 (Shallow Pullback), the real blow landed with Bar 66.
This high-conviction bear trend bar decisively broke the 25-bar bullish trendline. Sellers turned what seemed like a routine pull back into a deep, two-legged correction (Two-Legged Pullback / ABC).
The Battle at Support: Liquidity Sweeps and Bear Traps
Bearish order flow accelerated its second leg (Leg 2) with Bar 70, a bear trend bar that showed clear selling intent, though it failed to reach the structural support at $4,330 (the Bar 56 higher low).
This is where market psychology and price action shine. The current bar (following B70) executes the definitive maneuver: it sweeps below the $4,330 support, printing a low of $4,286.97. This intra-bar dip sparked panic among retail investors who dumped their positions, while bears shorted the breakdown expecting a deeper collapse.
However, institutions capitalized on this liquidity. Responsive buyers absorbed the entire supply, driving price back up and leaving a long lower tail. This price action creates a failed bear breakout, trapping bears at the bottom of the move.
Outlook: What to Expect from PAXG/USDT?
The market presents two primary scenarios based on how this liquidity trap resolves:
- Bullish Resumption (High Probability):
If the current bar manages a daily close near its high, it will confirm the bear trap. By trapping sellers, buyers will project a reversal move toward the $4,440 – $4,585 resistance zone. Clearing the structure of Bar 59 clears the technical path straight to $4,760.
- Bearish Continuation (Medium/Low Probability):
If sellers regain momentum, absorb buying power, and force a strong bar close below $4,286, the bullish structure invalidates. This scenario would trigger a measured move targeting the previous resistance cluster of Bars 13 and 29 around $4,200.
Price action in PAXG/USDT offers a masterclass in how liquidity pools operate. It isn’t just about lines on a chart—it’s about understanding where orders cluster and how smart money leverages panic to accumulate positions. The close of the current bar will dictate who wins the battle at $4,300.
Disclaimer: This article is strictly for educational and informational purposes. Trading cryptocurrencies and digital assets carries a high level of risk and may not be suitable for all investors. Always conduct your own research before making financial decisions.

Communications Professional. Crypto Enthusiast. Economic Journalist. Bitcoiner & Altcoiner.