The Render (RNDR) distributed computing ecosystem is navigating a critical moment in its market structure. After a correction that threatened to break the trend, price action generated a “bear trap” signal by re-entering its primary technical formation. Currently trading at $1.832, the asset is caught between the invalidation of a Head and Shoulders pattern and the reactivation of momentum that could target $2.70.
The Broadening Wedge Challenge
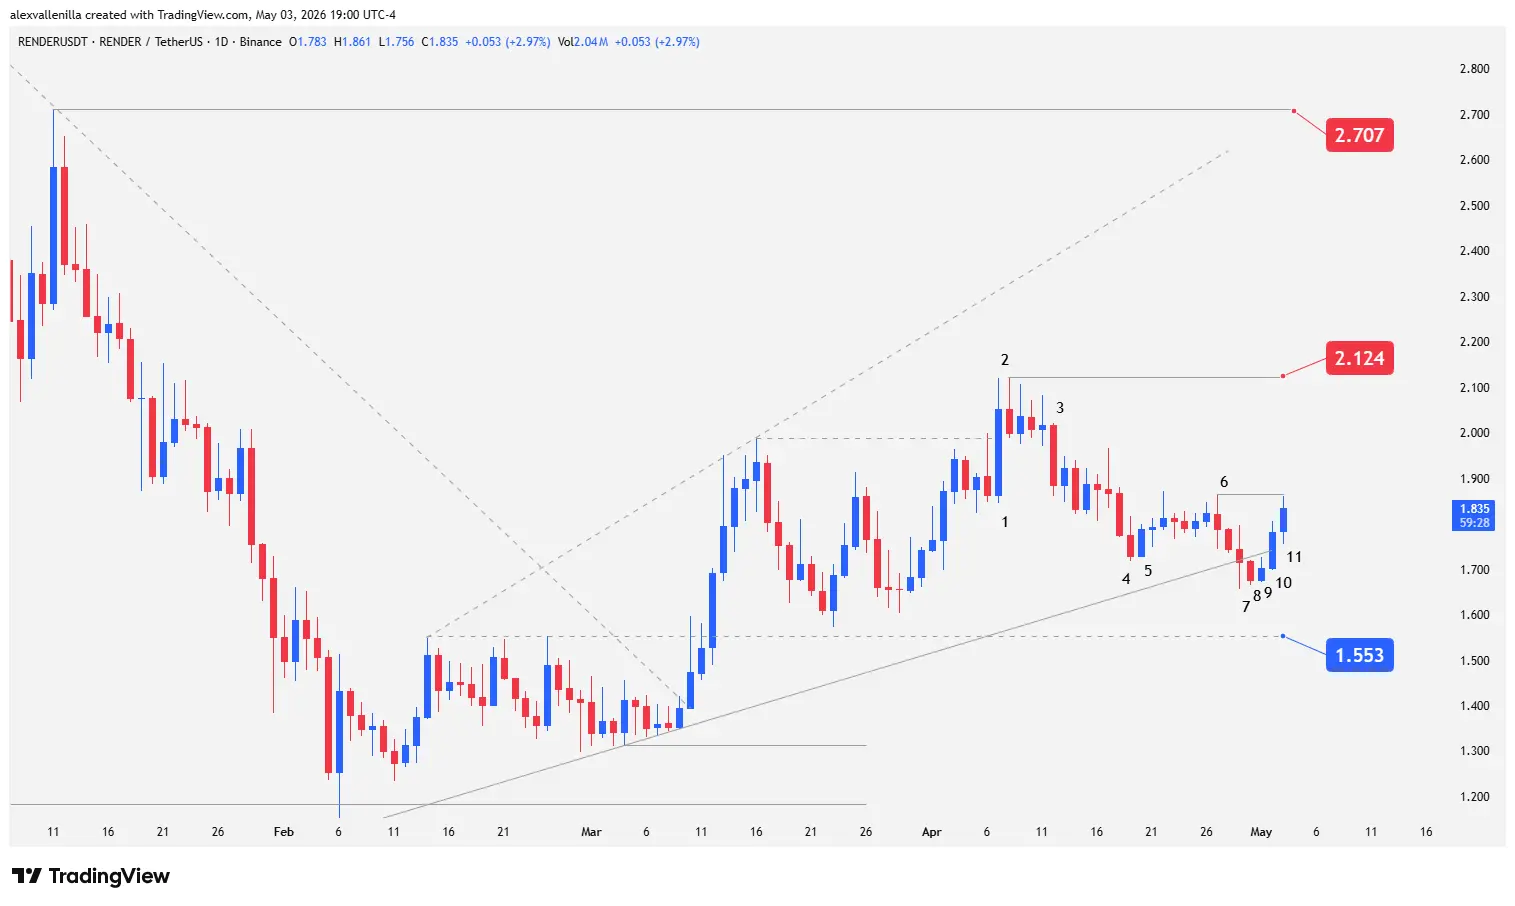
Render is currently moving under the influence of a bullish broadening wedge. While this pattern is often complex due to increasing volatility, the asset demonstrated resilience after breaking a previous 460-bar downtrend. Despite posting a 41.72% gain Year-to-Date (YTD), historical pressure remains, with one-year (1Y) performance still sitting at -62.34%.
The recent drop from highs of $2.124 cast doubt on the health of the move, but the latest daily close suggests that the pessimism may have been premature.
Technical Analysis: The Bar Narrative
Price action on the 1D chart reveals a tactical battle where every bar tells a story of exhaustion and recovery:
Bar 1: A decisive breakout from congestion and the $1.988 resistance. It showed high-quality demand, though it failed to test the top of the wedge.
Bar 2: Marked exhaustion. A pronounced upper tail confirmed that bulls lost steam before reaching the upper boundary of the formation. It established key resistance at $2.124.
Bar 3: The crash. This strong bearish bar confirmed the end of the initial euphoria, wiping out nearly all of Bar 1’s gains and triggering chain liquidations.
Bars 4 to 6: A period of indecision. While Bar 4 marked a selling climax without touching the lower trendline, the following bars (including “barbed wire” price action) showed tight consolidation. Bar 6 acted as a Doji that increased volatility.
Bars 7 and 8: Bears attempted a knockout. Bar 7 broke wedge support, but Bar 8 (an inside bar) failed to provide follow-through, suggesting that supply was drying up.
Bar 10: The pivot point. Bulls successfully pushed price back inside the wedge, confirming a bear trap and trapping those who sold the Bar 7 breakdown.
Bar 11 (Current): Trading at $1.832. Although showing low momentum, it is a “High 2” setup (a second buy attempt). Its mission is to clear the Bar 6 high to invalidate a dangerous Head and Shoulders (H&S) pattern lurking within the structure.
Scenarios: Invalidation or Pullback
The market is at an equilibrium point. If Bar 11 manages to close higher and break the Bar 6 high, the bearish H&S formation would be negated. This would likely attract institutional buyers to retest the $2.124 zone.
If this momentum fails, critical support sits at $1.553. A drop below this level would confirm the bearish structure and target new lows. However, if Render manages to consolidate above $2.124, the path clears for a fourth push toward $2.707—a historical resistance that would mark the beginning of a new bullish era for the token.
Render is executing a classic technical maneuver to flush out “weak hands.” The success of the “High 2” setup will be the catalyst defining whether RNDR regains its luster or retreats back into the shadows of the bear market.
Disclaimer: This analysis is for informational and educational purposes only. It does not constitute financial advice. Investing in crypto assets involves a high risk of capital loss.
Communications Professional. Crypto Enthusiast. Economic Journalist. Bitcoiner & Altcoiner.