For the second consecutive month, bitcoin (BTC) closed in positive territory, accumulating an 11.81% gain at the end of April 2026. Following marginal growth in March (1.96%), the digital asset appears to have found its rhythm within a complex macroeconomic environment. Price resilience, which remains firm in its long-term bullish trend, comes as traditional markets digest the consequences of the Strait of Hormuz blockade and the surge in crude oil prices—factors pushing investors to seek alternatives outside the conventional financial system.
The Digital “Safe Haven” Facing the Energy Conflict
The narrative of bitcoin as a refuge is strengthening. The geopolitical crisis between the United States and Iran caused several exporting countries to liquidate gold positions to obtain immediate liquidity due to restrictions on crude sales. In this scenario, BTC absorbed part of that capital flow, acting as a counterweight to oil volatility. Despite bears’ attempts to seize control, the technical structure of the last 40 months continues to dictate the market’s pace.
Technical Analysis: Anatomy of the Recovery (Bars 1 to 5)
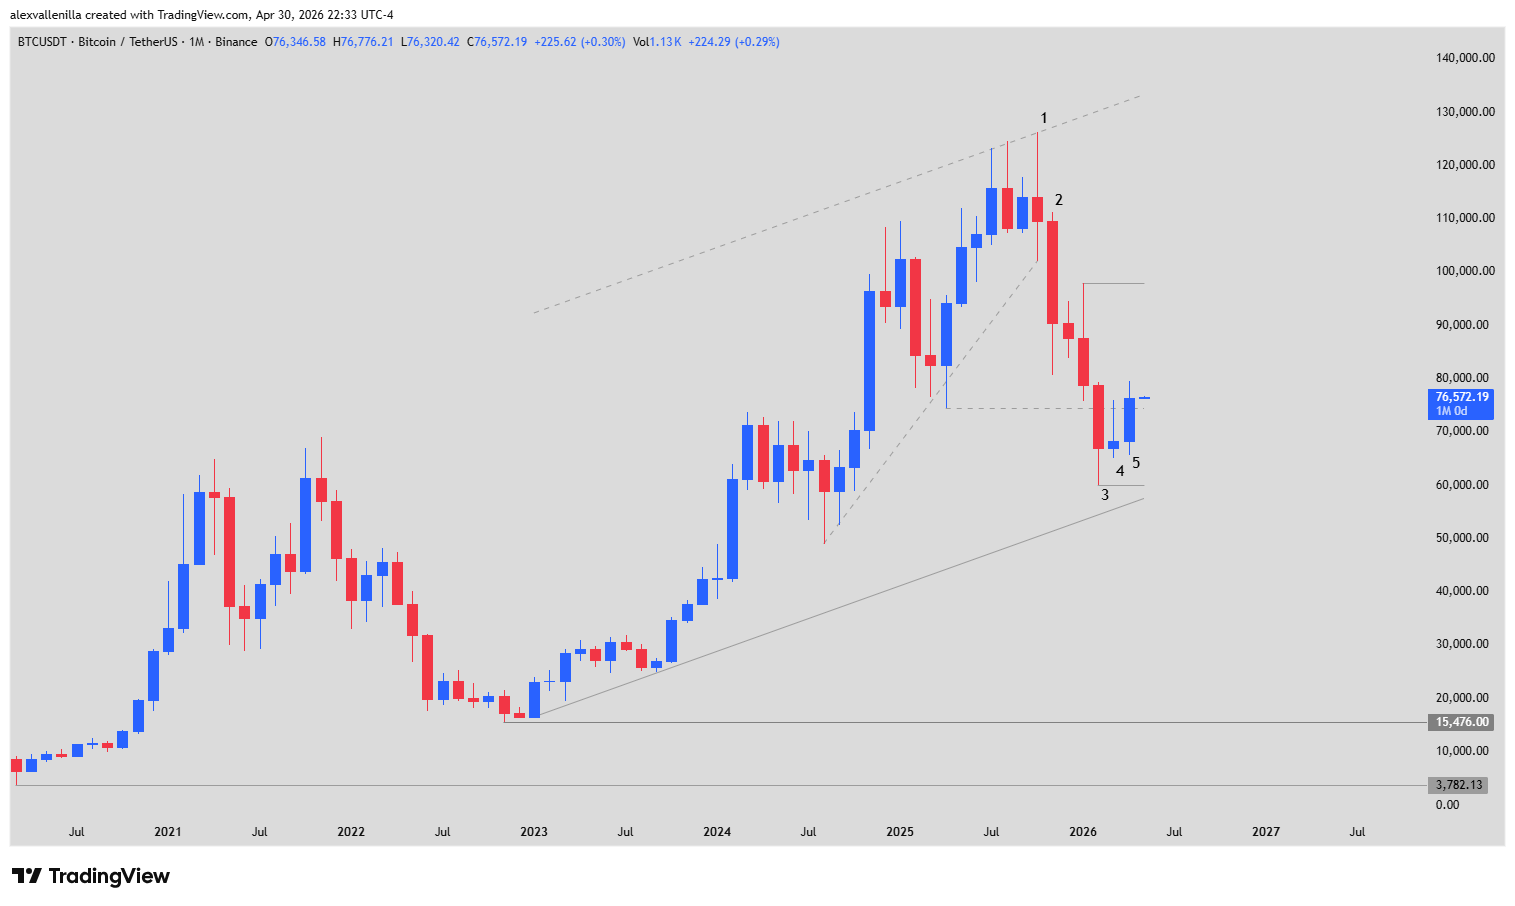
Price action on the monthly (1M) chart reveals a tactical battle between supply and demand, where every candle tells a story of capitulation followed by absorption.
Bar 1 (Top Exhaustion): The cycle began with a doji at the end of an ascending channel, warning of a trend reversal after momentum exhausted within a 14-month wedge.
Bar 2 (The Violent Breakout): A massive bearish candle (-17.56%) confirmed the wedge breakout, shaking out leveraged positions and seeking liquidity at lower levels.
Bar 3 (The $60,000 Floor): This bar broke the key $74,500 support but established a new psychological level at $60,000. Although it threatened the long-term trend, price respected the dynamic trendline that has supported the asset for 40 months.
Bar 4 (Consolidation and Bearish Fatigue): A bullish inside bar demonstrated that sellers lost momentum. By failing to retest the $60,000 support, the market primed itself for a bounce.
Bar 5 (Bounce Confirmation): This is April’s centerpiece. Price took out the previous bar’s high and closed above $74,500 (former support, now reclaimed resistance). This action confirms bullish continuity and the entry of buyers absorbing available supply.
Outlook: Heading Toward $97,900?
The current structure suggests an accumulation zone with low volatility. A close above $74,500 clears the path to target the $97,900 zone in the coming months, provided price consolidates above the Bar 5 high. Conversely, a retracement would see price revisit the dynamic support located at $57,500, where the health of the primary uptrend converges.
Bitcoin is not only surviving a five-month correction but is utilizing the geopolitical crisis to validate its investment thesis. Technical discipline at support levels will serve as the compass for investors in the upcoming quarter.
Disclaimer: This article is for informational purposes only and does not constitute financial advice. Investing in crypto assets carries a high risk of capital loss.
Communications Professional. Crypto Enthusiast. Economic Journalist. Bitcoiner & Altcoiner.