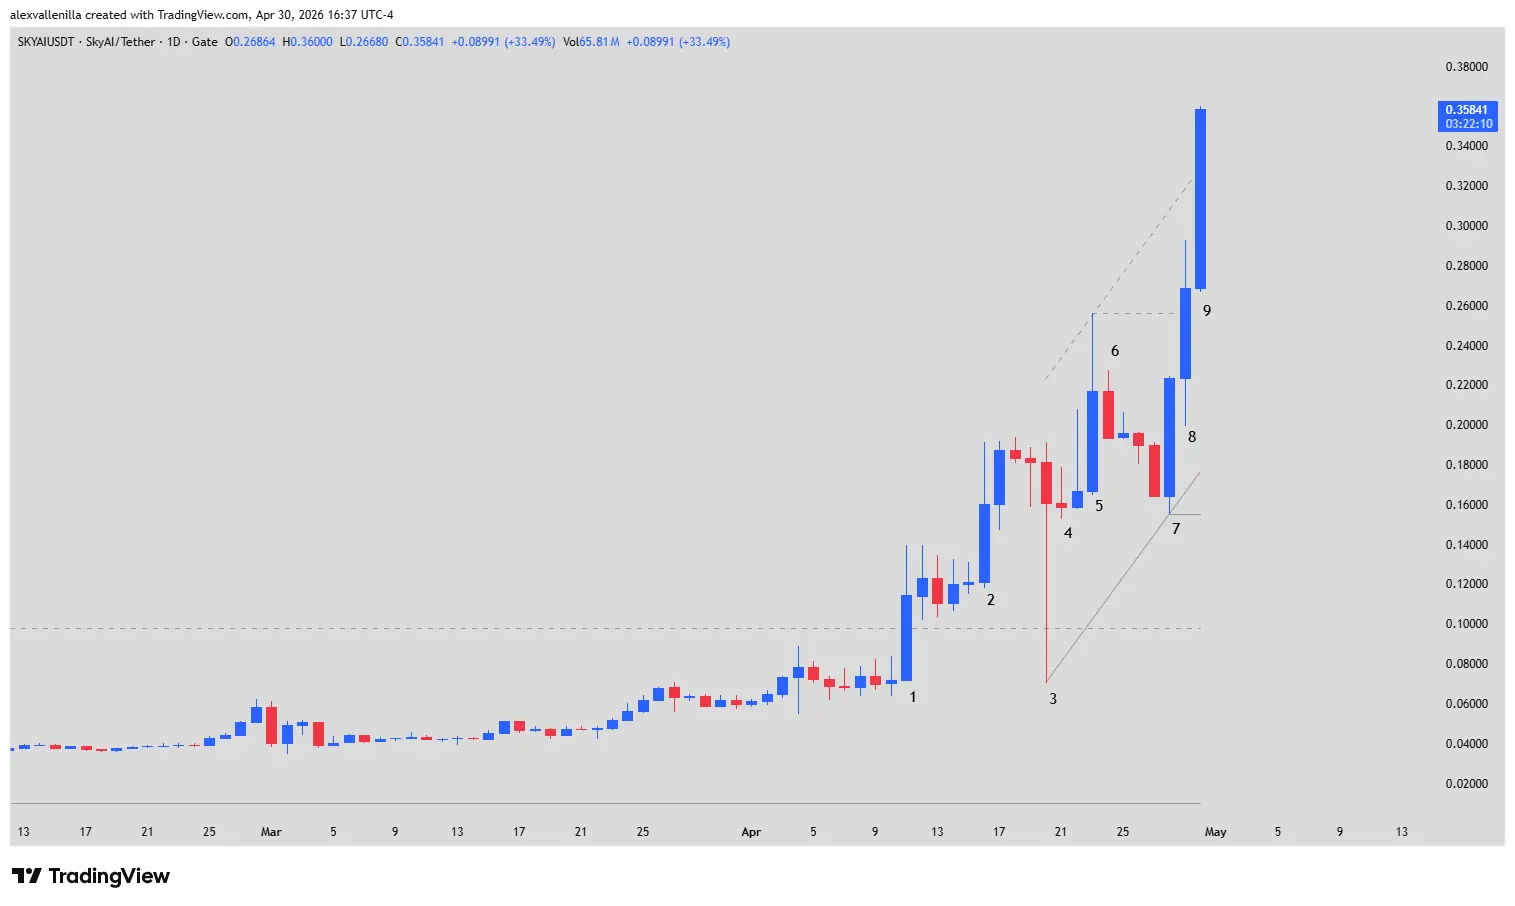
The decentralized finance ecosystem has an undisputed protagonist today: SKYAI. After remaining dormant in a sideways trading range for over 300 days, the asset woke up with unusual strength, breaking the psychological resistance at $0.0980 and climbing to $0.3577. However, this vertical ascent, which is now carving a parabolic wedge on the daily chart, has triggered alarms for technical analysts, who warn of a potential buying climax that could result in a necessary correction to stabilize the trend.
From Breakout to Tight Channel: The Anatomy of the Rally
SKYAI’s current structure is not a matter of chance but a classic transition of market phases. We moved from a prolonged Trading Range into a violent Breakout, which quickly evolved into a high-urgency tight channel. In this environment, buyers displayed such aggressiveness that price entered a “vacuum phase,” moving dangerously far from its historical averages.
Technical Analysis: The 9-Bar Narrative
To understand the current risk, it is imperative to break down price action bar by bar, where each candle tells part of the battle between supply and demand.
The Breakout Phase (Bars 1 to 5)
Bar 1: A masterclass bullish candle with a 58.92% gain. Its close above $0.0980 cleared a 332-bar resistance, confirming a clean breakout and a drastic spike in volatility.
Bar 2: Momentum continued with an additional 32.32%. Although it left an upper tail (profit-taking), it broke through the initial congestion and validated the strength of the bulls.
Bar 3: An Outside Down Bar that generated temporary panic. Its low pierced previous support, but buyers defended the zone with such violence that the close remained in the upper third. This was a failed “Deep Pullback” that strengthened the structure.
Bar 4: A low-volatility Doji. The market caught its breath after the previous bar’s scare, showing that sellers lacked follow-through.
Bar 5: Final breakout of the consolidation flag. It recorded a 29.99% gain and marked a new all-time high at $0.2560, a level that now serves as our key support reference.
The Parabolic Phase and Climax (Bars 6 to 9)
Bar 6: A bearish inside bar that failed to provide selling continuity. The market simply absorbed the available supply.
Bar 7: The definitive Signal Bar. A 36.04% outside candle that engulfed the previous correction, catching bears in a Bear Trap and activating parabolic mode.
Bar 8: Confirmation without overlap. It broke the high of Bar 6 without hesitation, establishing a micro-channel where price no longer tests previous lows.
Bar 9 (Current): Represents the buying climax. With a 33.59% move, price is overshooting the bullish channel. The disproportionate size of this bar compared to the 20-period average suggests Buy Exhaustion.
Scenarios and Projections: What to Expect Next?
Scenario 1: Technical Retracement (High Probability)
Due to the climatic nature of Bar 9, the healthiest outcome is a sideways or bearish correction lasting 2 to 5 bars. A larger Ten Bar Two Leg (TBR) correction is also possible. The natural target for this pullback is the Bar 5/6 level ($0.2560), which must now act as structural support.
Scenario 2: Final Flag (Low Probability)
Price could stall in the upper third of Bar 9, forming a Final Flag. This would allow for one last marginal push toward $0.4000 before a severe correction.
Prudence Amid Euphoria
SKYAI is in a state of clear technical overextension. While the trend is powerful, the risk-reward ratio for new buys at current Bar 9 levels is poor. Technical recommendations dictate waiting for a High 2 (a second buy entry attempt after the correction) to re-enter with a controlled risk structure.
Disclaimer: This article is for informational and educational purposes only. It does not constitute financial advice or investment recommendations. Trading crypto assets carries a high risk of capital loss.
Communications Professional. Crypto Enthusiast. Economic Journalist. Bitcoiner & Altcoiner.