
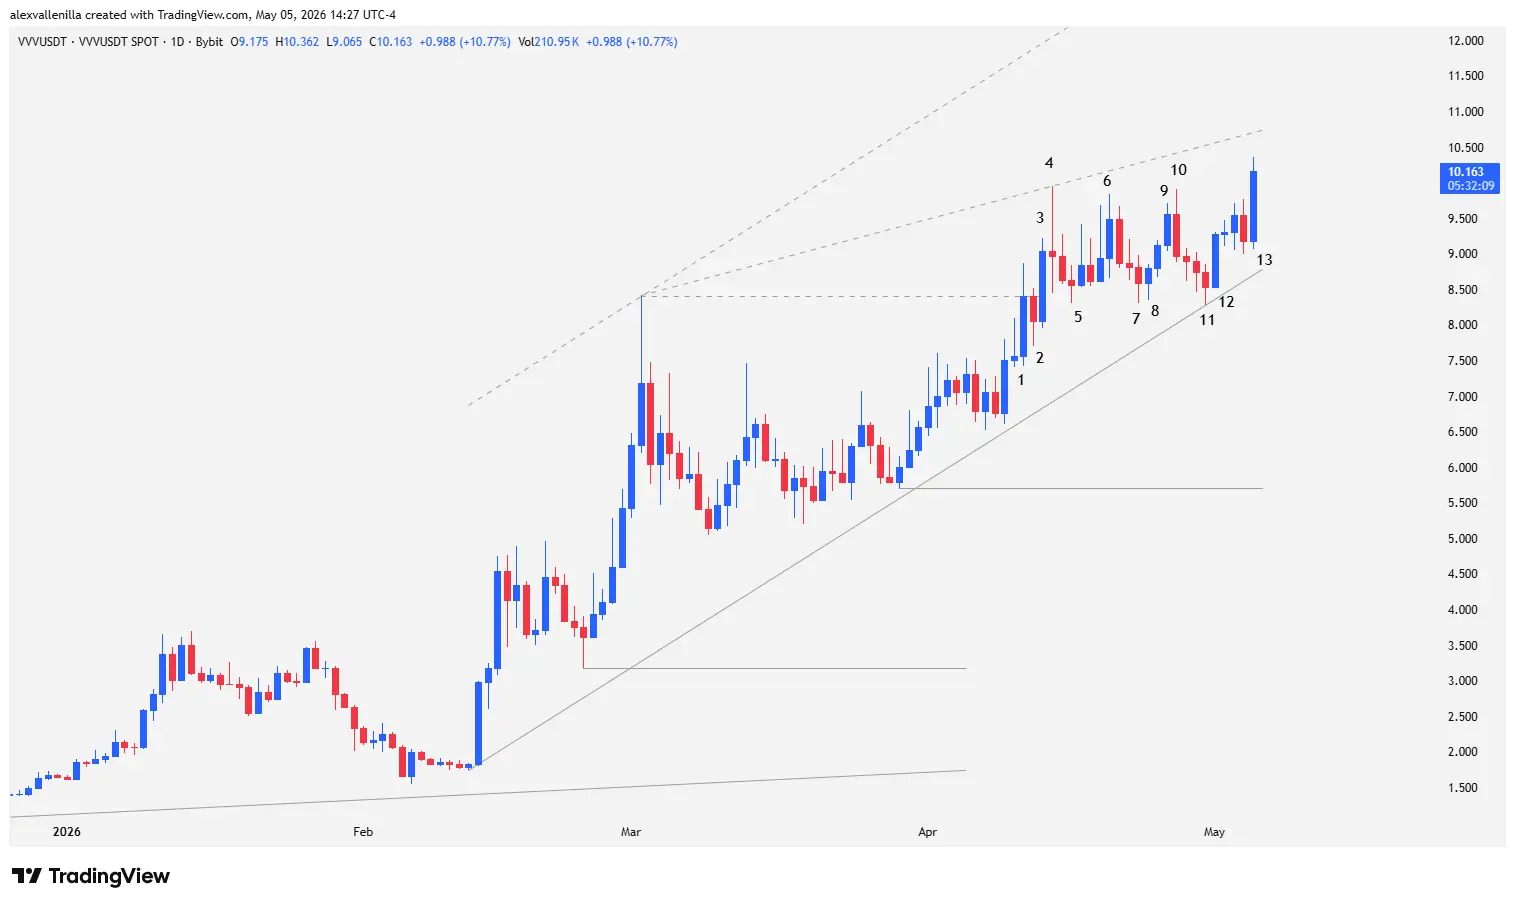
Venice Token (VVV) captured market attention after piercing a technical resistance level that remained unbreakable for 42 sessions. During a session marked by a 10.42% surge, the asset is currently trading at $10.133, sitting in a critical zone where the buildup of tension between buyers and sellers anticipates a volatile move. Price action is now caught between a bullish continuation toward $13.91 or a corrective retracement toward fundamental support levels.
The Awakening of VVV: Overcoming Long-Term Walls
After weeks of uncertainty where price seemed to falter, Venice Token bulls managed to print a recovery dynamic. The key to this move lies in flipping $8.411, a supply zone that had systematically rejected the price.
However, the current structure does not signal total freedom. Price has become boxed within a rising wedge, a technical pattern that, while accompanying the 83-bar uptrend, often precedes market exhaustion. The current narrative suggests that although lows are consistently higher, the strength to conquer new highs is meeting an invisible yet persistent resistance.
Technical Analysis: The 13-Bar Battle
Recent behavior on the daily chart (1D) reveals a power struggle we can break down step-by-step:
Bars 1 and 2: Bar 1 acted as a “bullish blade” that pierced $8.411, though without a clean close. Bar 2 (a bearish inside bar) attempted to reverse the move, but the fact that its low remained above the previous bar’s low showed the bears’ initial inability to retake control.
Bar 3: This represents the definitive breakout. With a solid body closing more than halfway above the resistance, this candle injected the necessary volatility to validate the zone shift.
Bars 4 to 6 (The Wedge Formation): On Bar 4, the market formed a large doji, establishing the ceiling of the wedge channel. Bar 5 brought indecision, while Bar 6 failed to test the previous high, marking the first symptom of lost momentum.
Bars 7 to 9: Consolidation continued. Despite Bar 8 trapping the previous session’s sellers, Bar 9 confirmed that highs are flattening, consolidating the compression structure.
Bars 10 and 11: Bar 10 (a bearish outside bar) threatened a trend reversal, but Bar 11 lacked follow-through. The latter is vital, as its low functioned as a pivot point on the bullish trendline that has supported the move for 83 days.
Bars 12 and 13 (Current Situation): Bar 12 showed notable conviction with no lower wicks. Today, Bar 13 leads a 10.42% rally, surging past the highs of bars 10, 6, and 4. Price is looking to test the top of the wedge at $10.133.
The Wedge Trading Dilemma
The VVV structure is textbook: a loss of bullish momentum within a compression formation. If the current impetus manages to break the wedge to the upside, the next technical target sits at the dynamic resistance of $13.912. However, if supply dominates at the top of the pattern, the bearish scenario projects a measured move toward $5.71, a previous support level of significant relevance.
Disclaimer: This analysis is for informational and educational purposes only. Crypto asset trading carries high risk. It does not constitute financial advice or an investment recommendation.
Communications Professional. Crypto Enthusiast. Economic Journalist. Bitcoiner & Altcoiner.