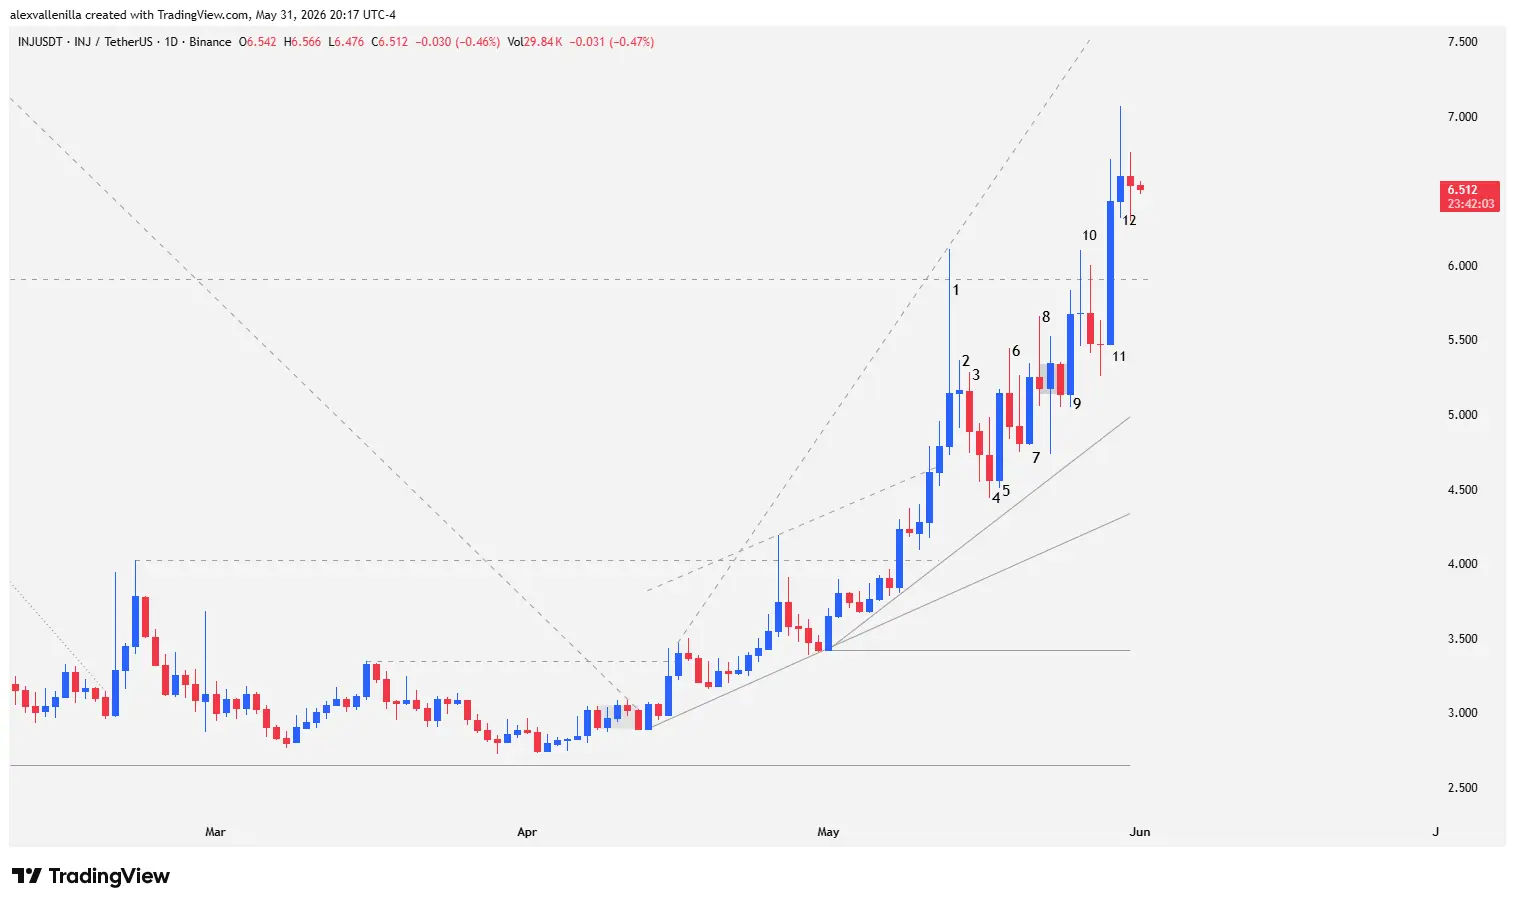
The Injective (INJ) token completed a decisive structural transition on its daily chart by piercing and consolidating above the key $5.90 resistance level. This move technically invalidates the persistent 760-bar bearish structure that dominated the asset. Through a sequence of institutional impulses and failed pullbacks from supply, buyers managed to flip this former ceiling into operational support. Despite posting a 46.16% contraction over the last twelve months, INJ accumulates a positive year-to-date return of 55.61% in 2026. This figure confirms the return of high-conviction capital to decentralized finance protocols.
Narrative Shift: The End of Bearish Dominance
The macroeconomic outlook for INJ experienced a radical shift. Price action managed to neutralize a 152-bar bearish leg, which was part of a larger 760-bar corrective cycle on the daily (1D) timeframe.
Clearing $5.90 represents a breakout above the last relevant lower high of the previous trend. By establishing sustained closes above this level, the market invalidates the “sell the rally” strategy that bearish traders executed systematically. The current structure transitions into a medium-to-long-term accumulation and expansion cycle, backed by a notable increase in volatility and absorption volume.
Technical Price Action Analysis
Bar 1: Bulls attempted a vertical impulse that temporarily pierced $5.90, exiting a 48-bar ascending channel. However, the session closed as a pin bar with an extensive upper tail (triple the body size), booking a net gain of just 7.45%. Bears defended the zone, creating a bull trap. Despite the rejection, the high of this bar served as an anchor to plot a broadening wedge alongside the base of the original channel.
Bar 2: A doji forming an inside bar evidenced immediate buyer exhaustion following profit-taking from the previous session.
Bar 3: A bearish pullback bar that confirmed temporary weakness by closing below the low of Bar 2. However, it left a lower tail that demonstrated the first intentions of supply absorption.
Bar 4: An outside bar with a bearish close. It presented an upper tail identical to its body size, indicating selling pressure. Despite the bearish dominance at the close, the session low was higher than previous ones, keeping the structural bullish sequence intact.
Bar 5: An institutional conviction bar. A solid 12.90% bullish body with almost no wicks. It printed a higher low than Bar 4 and closed above its high. This price action betrays the entry of “smart money” protecting the trend.
Bar 6: A bearish close with a massive upper shadow. Bulls tried to push higher but ran into limit sell orders at the top.
Bar 7: A 9.17% bullish impulse with a shaved base (no lower tail). Buyers absorbed supply right from the open at higher prices, halting the previous two-bar pullback.
Bar 8: A pin bar with a bearish close whose high exceeded that of Bar 6. Although the upper tail was huge compared to a tiny body, it reflected the bears’ inability to sink the price, plunging the market into a congestion phase.
Bar 9: Reactivation of institutional capital with a 10.46% bullish candle. It broke the congestion, cleared previous highs, and left the price at the doorstep of the key resistance.
Bar 10: A large, wide-range doji that managed to pierce $5.90 for the first time since Bar 1. The price closed where it opened due to seller rejection. The two subsequent bars showed negligible pullbacks with higher lows, confirming that bears lacked the strength to regain control.
Bar 11: The decisive breakout bar. A violent, expansive 17.58% move that definitively fractured $5.90. Lacking a lower tail, buyers dominated from the very first second. More than half of the candle body closed above the resistance, validating the structural breakout within the broadening wedge.
Bar 12: A pin bar with a bullish close and an upper tail that tripled its body. Although it marked a new high, the close could not sustain the top of the range, giving way to a subsequent bearish doji that initiated a defensive lateralization phase over the new support.
Projections: Targets and Invalidation Zones
Order flow technical analysis validates the existence of two perfectly measured bullish legs. After consolidating the old $5.90 resistance as strong support, the market establishes a measured technical target at $7.75, reachable in the coming sessions if the price remains above the breakout zone.
Should a liquidation event occur and pierce below $5.90, the immediate bullish bias would be neutralized. In that scenario, INJ would look for support at the dynamic floor of $4.98, guarded by a 30-bar secondary counter-trend line.
Injective completed a textbook market structure shift through a clean price transition and an institutional absorption pattern. Converting the $5.90 zone from resistance to support unlocks a friction-free path toward $7.75. The absolute control of buyers against the failed pullbacks of supply suggests that the crypto asset has formally initiated a new expansionary cycle.
Disclaimer: This analysis is for informational and educational purposes only, based on historical price action, and does not constitute financial advice or investment recommendations. Cryptocurrencies are highly volatile assets; trade at your own risk.
Communications Professional. Crypto Enthusiast. Economic Journalist. Bitcoiner & Altcoiner.