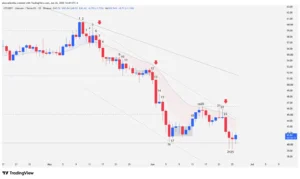
The Litecoin (LTC) market is going through a crucial moment on its daily (1D) chart. Following a prolonged bearish dominance, the price is trading at a critical structural confluence zone: $40.30. This technical level acts as the bulls’ last line of defense, representing a historical support that the market had not visited for more than three years (1,474 bars). Current price action reveals a fierce battle for order flow, where failing to maintain this technical floor could open the doors to a capitulation scenario toward $24.00. So far in 2026, LTC drags a 45.86% year-to-date contraction, accumulating a 50.86% year-over-year loss that forces institutional and retail traders to reevaluate their exposure to the asset.
Anatomy of the Chart: False Breakouts and Bull Traps
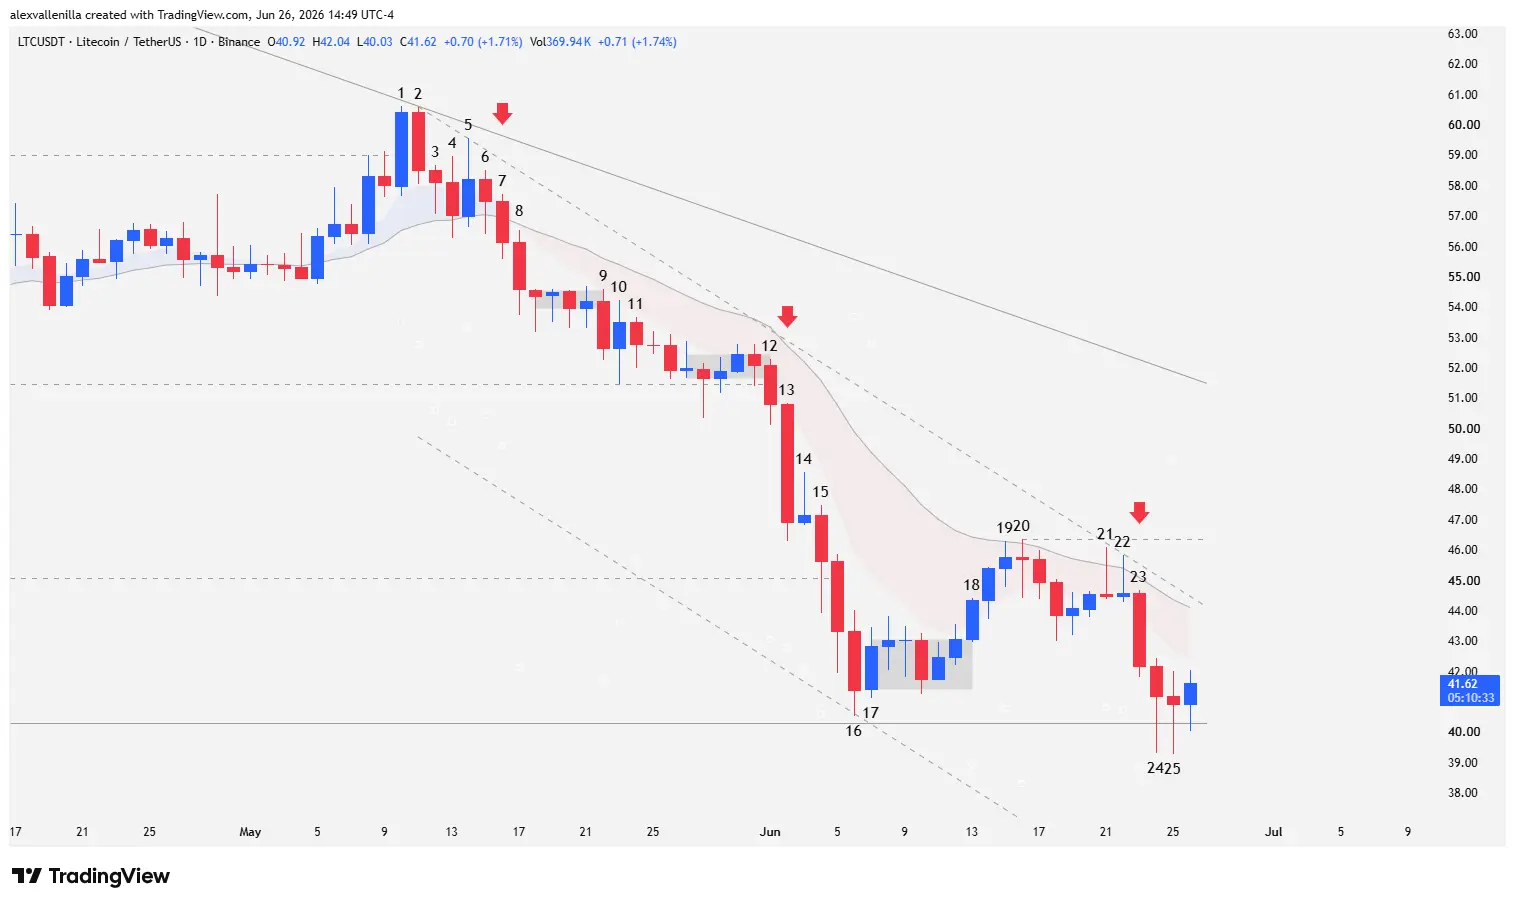
The current macro structure originated from a classic market trap at the top of a sideways range. Bar 1 printed as a strong conviction bullish candle, managing to close its body above the key resistance of $59.00. However, buyers’ euphoria was immediately neutralized. Bar 2 invalidated the previous move by forming a tweezer top pattern (practically identical highs) and wiping out almost the entirety of the prior advance. This rejection confirmed the bull trap and served as an anchor to plot the main downtrend line that has dominated the last 172 bars of the cycle.
From that point on, supply completely controlled the order flow. Recovery attempts, such as the one in Bar 5, showed clear exhaustion through long upper tails (rejection wicks), culminating in reversal failures (Bar 6). Confirmation of the bearish dominance consolidated in Bar 7, which pierced the 20-period exponential moving average (20 EMA) and transformed into a high-probability Low 2 sell structure. Its activation in Bar 8 accelerated the price into a “barbed wire” congestion phase before a new bearish breakout in Bar 9.
The Range Breakout and Supply Acceleration
The definitive break of the local macro equilibrium occurred in the block between bars 12 and 13. Bar 12 breached the $51.47 support, a level that defined the base of a 93-session sideways structure. Bar 13, a wide-range bearish candle with massive institutional volume, forcefully validated the breakout. This bar acted simultaneously as a Low 2 sell trigger and a strong conviction candle, injecting the necessary panic to crash the price.
A key educational element regarding market psychology emerged in Bars 14 and 15. Early buyers tried to build a floor with a small inside candle (Bar 14), but Bar 15 broke its low, triggering a massive execution of the trapped bulls’ stop losses. The subsequent reversal failure functioned as technical fuel, accelerating the drop below $45.07 (the prior low of the 138-bar structural trend).
Testing $40.30: Absorption or Imminent Capitulation?
The current price is confined within a 47-bar secondary minor downtreeen channel. Following a two-legged downward move that temporarily culminated in Bar 16 and consolidated a six-session micro-range, bulls attempted a counterattack in Bar 19. However, this move reflected a clear deceleration in the candle bodies and was rejected with pinpoint accuracy upon testing the 20 EMA for the first time in 29 days, proving that the dynamic average continues to act as an inflexible resistance.
Selling pressure resumed its march with Bar 23 and Bar 24 (the latter a high-volatility pinbar), forcing the breach of the historical $40.30 support.
Bar 25 and the developing session (the current bar at the time of this report) present highly relevant characteristics for price action:
Activation and Absorption: Bar 25 swept the previous lows, activating short sell orders, but managed to close above $40.30.
Local Buying Pressure: The current bar shows a notable lower tail that doubles the size of its technical body, evidence that strong hands are actively defending this historical level by absorbing the circulating supply.
Structural Scenarios for LTC
The market sits at a technical fork in the road where traders must watch the close of the upcoming daily candles:
Bullish Scenario (Relief Rally): To confirm a local change of character, LTC must consolidate the current support, test the 20 EMA again, and close above the minor channel’s dynamic resistance at $44.12. A clean breakout of that zone would project the price toward the local resistance of $46.36 (Bar 20 high), opening the path to target the top of the main downward channel.
Bearish Scenario (Trend Continuation): If supply overpowers the current absorption and the price consolidates daily closes below $40.30, the market structure will enter a massive liquidation phase. The next technical target lies in the psychological and structural zone of $24.00, a swing low support that the market has not recorded in the last 2,299 bars.
Litecoin price action reflects a prolonged capitulation that dragged the price to critical levels from three years ago. Although the presence of lower tails at the $40.30 support suggests the first signs of defensive accumulation by buyers, supply firmly controls the macro trend. The market demands confirmation of a structural bounce before anticipating the definitive end of this bearish cycle.
Disclaimer: The technical analysis presented in this article is provided for informational and educational purposes only and does not, under any circumstances, constitute financial investment advice, recommendation, or invitation.
Communications Professional. Crypto Enthusiast. Economic Journalist. Bitcoiner & Altcoiner.