The VIRTUAL cryptocurrency market faces a decisive inflection point on the daily (1D) timeframe. After completing an exhausting long-term downtrend cycle consisting of 444 bars of lower highs, alongside a secondary 64-bar bearish structure, smart money made its appearance. The supply’s inability to break the primary support at $0.5204, combined with a recent trap maneuver targeting late sellers in bars 67 and 68, keeps price ranging within a critical side-channel before defining its next major macro move.
Market Structure: From Mini Downward Channel to Trading Range
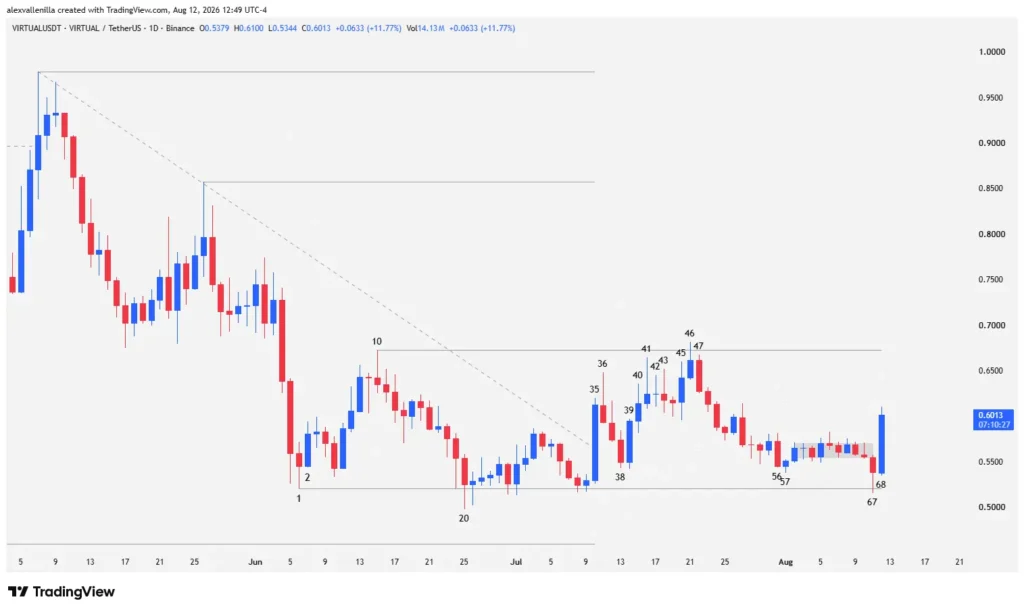
VIRTUAL’s recent dynamics reveal a clear shift in participant psychology. The 64-bar mini downtrend—which acted as a secondary acceleration channel within the primary trend—began losing momentum when supply hit the $0.5204 support originally established in Bar 1.
The failure to break this zone during the Bar 20 retest confirmed a technical double bottom pattern. Since then, the asset remains trapped within a trading range bounded by two key levels:
Key Resistance: $0.6728 (Bar 10 High).
Key Support: $0.5204 (Bar 1 / Bar 20 / Bar 67 Low).
Institutional Breakout and Penetration Attempts (Bars 35 to 46)
Bar 35: Smart money stepped in with a strong high-conviction bullish bar (wide-range marubozu), cleanly breaking the 64-bar mini downward channel. The breakout placed over 50% of its body above the prior trendline, backed by volume well above the 20-day average.
Bars 36 to 38: Bar 36 printed an inverted hammer that stalled momentum right before testing resistance at $0.6728 (Bar 10 high). Bar 37 and Bar 38 pulled back; however, Bar 38’s low stayed above the baseline support, printing a higher low.
Bars 39 to 41: Bulls landed a second blow in Bar 39, forming a tweezers bottom pattern alongside Bar 38. Its close absorbed sellers and triggered a failed pullback. Bar 40 provided follow-through but left a prominent upper tail. Subsequently, in Bar 41, bears fiercely defended $0.6728, leaving an inverted hammer gapping away from resistance.
Bars 42 to 46: Price entered compression. Bar 42 (inside bar/doji) and Bar 43 (outside bar with an upper tail) formed a sequence of selling pressure. Bar 44 failed to confirm the downside breakout, allowing Bar 45 to re-attempt an attack on resistance. Finally, Bar 46 managed to pierce $0.6728, but the move collapsed before the close, printing a bull trap and a double breakout failure relative to Bar 41.
The Two-Legged Pullback and Capitulation (Bars 47 to 57)
Bars 47 and 48: Bar 47 engulfed Bar 46’s body, validating resistance rejection and initiating a two-legged corrective structure that extended through Bar 57.
Bar 56: Following a deceleration phase, supply attempted to break a micro-range via Bar 56, which acted as a small capitulation bar that failed to approach the critical $0.5195 / $0.5204 support zone.
Bar 57: Buyers trapped the aggressive supply in Bar 57, driving an immediate reversal that left Bar 56 “naked” without bearish follow-through.
Breakout from “Barbed Wire” and Current Bear Trap (Bars 58 to 68)
Bars 58 to 66: The asset drifted into a “barbed wire” phase: a micro-range featuring tiny-bodied bars, multiple wicks on both sides, and a collapse in volume. This compression clearly signaled institutional accumulation.
Bar 67: Broke the congestion to the downside. Price tested the primary support at the Bar 1 low, slightly piercing it during the session. However, smart money absorbed the available supply, closing far from the low and leaving a prominent lower wick. Across all 67 bars on the chart, no daily close has settled below this level.
Bar 68 (Current Developing Bar): Acts as a textbook bear trap. By triggering the stop losses of late sellers from Bar 67, Bar 68 displays a highly efficient bullish impulse: large body, virtually nonexistent tails, and significant volume expansion.
Structural Outlook: What Lies Ahead?
Currently, VIRTUAL trades under the inertia of the secondary 64-bar downtrend within the trading range. To definitively shift market psychology, bulls must overcome key barriers:
Bullish Scenario (Reversal Validation): Buyers must secure a strong daily close above $0.6728 (Bar 10 High). Consolidating price above this level would invalidate the prior bearish structure and clear the path toward the next institutional resistance at $0.8577.
Bearish Scenario (Breakdown Risk): If supply absorbs Bar 68’s momentum and forces a daily close below the $0.5204 support zone, the range structure fails. In that event, price would target the long-term macro support at $0.4593.
For now, traders continue playing the range: buying support defense ($0.5204) and taking profits near resistance ($0.6728).
Price action in VIRTUAL demonstrates that institutional accumulation around the $0.5204 support is aggressively contesting control of the market. The bear trap triggered between bars 67 and 68 opens a key window of opportunity for demand to challenge the $0.6728 resistance once again.
Disclaimer: This article is strictly for informational, educational, and journalistic purposes. It does not constitute investment advice, financial recommendations, or a solicitation to buy or sell digital assets. The cryptocurrency market carries high volatility; conduct your own analysis before making financial decisions.

Communications Professional. Crypto Enthusiast. Economic Journalist. Bitcoiner & Altcoiner.