

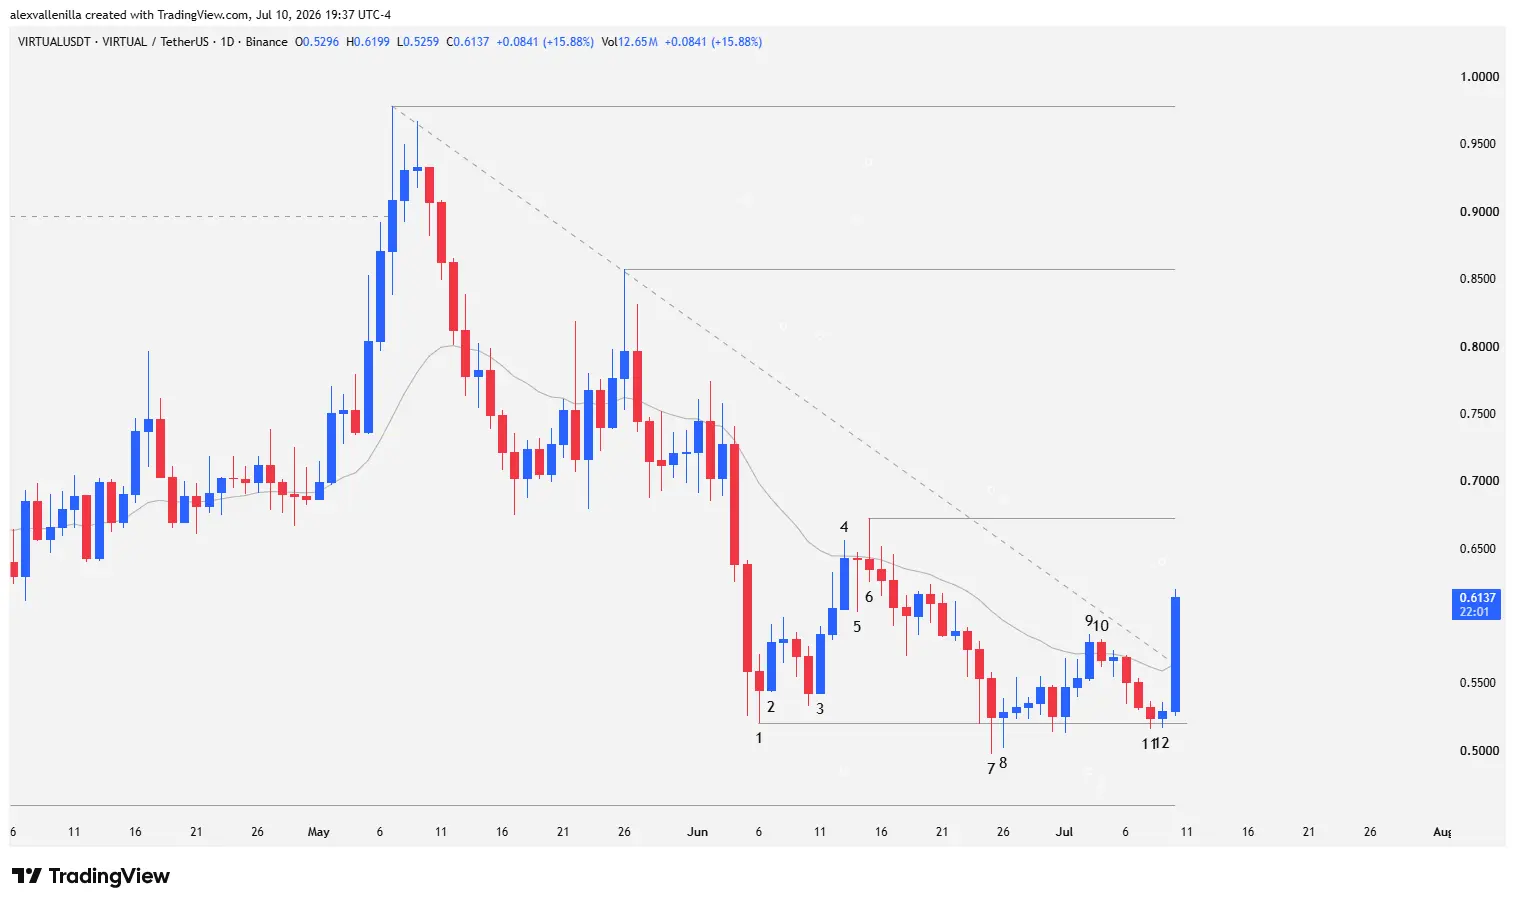
The VIRTUAL cryptocurrency market is experiencing a bullish shakeup on the daily (1D) chart. Following a prolonged period of bearish compression and institutional rejection at the upper $0.9783 zone, “smart money” aggressively entered today’s session. A high-conviction candle breaks the streak of lower highs, forcing bears to retreat and reviving optimism among retail traders and tech enthusiasts looking for the next major macro structure shift.
Macro Context: From Bull Trap to Concrete Floor
The previous structure of VIRTUAL reflects a harsh lesson in market psychology. After a decisive rejection at the $0.9783 resistance, bears thwarted an attempt to test the critical $1.1199 level—a zone that would have decreed a medium-to-long-term trend reversal.
Instead, the market executed a bull trap, where institutional traders heavily liquidated positions during the rally, triggering a severe two-leg correction. This plunge compressed the price against a definitive floor that buyers are aggressively defending.
Price Action Breakdown: Bar-by-Bar Analysis
To understand the current shift in dynamics, we must break down the direct order flow within the candlesticks:
Capitulation and the First Breath (Bars 1 to 3)
Bar 1: Stops the previous bleeding from a climatic capitulation candle. Buyers absorb the supply at the lows, leaving a noticeable lower tail. The price closes above the previous low, establishing solid support at $0.5204, which qualifies as a higher low against the 154-bar critical support located at $0.4593.
Bar 2: Confirms bullish intent. Buyers validate the support and close strong above Bar 1.
Bar 3: Following a minor two-bar correction, this candle keeps its low above $0.5204 without even testing it, triggering a three-bar consecutive bullish impulse.
The 20 EMA Wall and Bearish Exhaustion (Bars 4 to 6)
Bar 4: Bulls attempt to pierce the 20-period exponential moving average (20 EMA), but sellers defend the zone, causing a failed breakout.
Bar 5: Shows continuity of the rejection. It features a huge lower tail and an almost non-existent body (indecision), closing below the 20 EMA.
Bar 6: Bears take definitive control of the area with a bearish pin bar. Its long upper tail evidences the rejection at the new local resistance of $0.6728. This movement consolidates a series of lower highs.
Floor Defense and Institutional Inflow (Bars 7 to 12 and Current Bar)
Bar 7: Bears temporarily pierce $0.5204 but fail to close below it. The body completely overlaps inside the previous candle, signaling a total loss of momentum. The lower tails of the last three sessions confirm that demand is absorbing all available supply.
Bar 8: An inside doji with a bullish close introduces neutrality and halts the decline. It gives way to a brief sideways phase over the support.
Bars 9 and 10: Bar 9 manages to briefly clear the 20 EMA but establishes another lower high against the previous $0.8577. Bar 10, a bearish inside block, drags the price back below the moving average.
Bars 11 and 12: Price decelerates. Bar 12, with a minuscule range, demonstrates the absolute exhaustion of sell orders above $0.5204.
Current Bar: Smart money takes absolute control of the order book. This high-conviction candle breaks strongly above the 20 EMA and, crucially, breaches the high of Bar 9, breaking the sequence of lower highs.
The Future Outlook: Key Levels for Structure Shift
Today’s session changes the game in the short term. By invalidating the bearish compression, VIRTUAL now points directly to the local resistance of Bar 6 at $0.6728.
If the body of the current candle consolidates this close above the 20 EMA, bulls will have a clear path to target the major resistance zone at $0.8577. Overcoming this last bastion is a mandatory requirement if the ecosystem intends to change the macro structure and transition from a bearish market to a healthy bullish one. Conversely, if smart money pulls liquidity and the $0.5204 support gives way in the coming days, the price will inevitably seek historical lows at $0.4593.
Disclaimer: This analysis is presented solely for informational and educational purposes based on price action. It does not constitute financial advice, investment recommendations, or an invitation to trade digital assets.

Communications Professional. Crypto Enthusiast. Economic Journalist. Bitcoiner & Altcoiner.


