

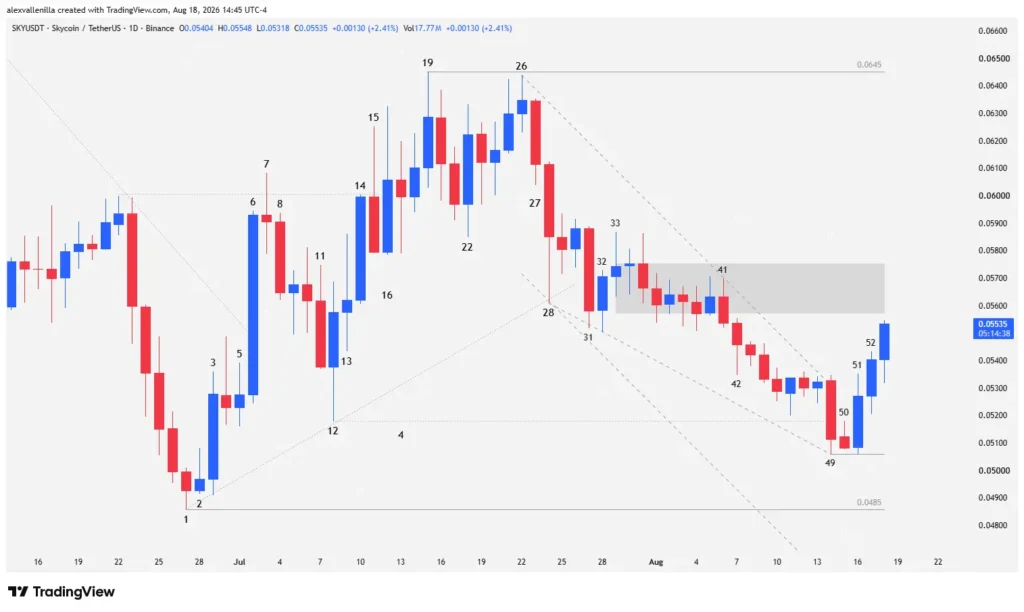
The Sky cryptocurrency ecosystem experiences an intense technical battle on its daily chart (1D) following a complex cycle spanning from bar 1 to the current bar 53. After confirming a bull trap at bar 26 and a subsequent bearish impulse that broke previous trendlines, buyers react strongly at bar 51 through a double-bottom pattern and a descending wedge. Currently, at bar 53, the price trades at $0.0557, challenging a critical resistance zone while institutions progressively absorb supply.
Anatomy of a Reversal: From Bull Trap to Capitulation
Structural Breakdown and Bearish Exhaustion
The movement starts when bar 31 breaks the bullish trendline that sustained the previous impulse born at bar 1. This event seals bar 26’s fate as a classic bull trap, where buyers failed to surpass the $0.0645 resistance level.
Subsequently, the price transitions into a micro-congestion range starting at bar 33, characterized by small bodies and a notable drop in trading volume. This pause precedes bar 41, which pierces the range downward with weak conviction, serving as an anchor for a new descending channel. Selling pressure finds its climax at bar 49, a capitulation bar that establishes a local support at $0.0505 without touching the previous impulse low of $0.0485.
Institutional Counterattack and Descending Wedge
Buyers respond immediately. Bar 50 acts as an inside bar confirming seller fatigue, setting the stage for bar 51’s counterattack. This high-conviction outside bar breaks both the 23-bar bearish trendline and a descending wedge formation with bullish implications.
Bar 52 consolidates this move by surpassing the previous high and recording a trading volume higher than the 20-day average, validating buying interest. At the time of this report, bar 53 tests a previous congestion zone that now operates as resistance, placing the price at $0.0557.
Technical Analysis: Order Flow Reading
Bars 31 and 32: Bar 31 breaks the 29-bar bullish channel, invalidating the previous cycle’s buying bias. Bar 32 attempts to contain the drop with a breakout failure, giving way to indecision.
Bars 41 and 42: Bar 41 breaches the upper congestion, tracing the ceiling of the new descending channel. Bar 42 confirms the move, but its long lower wick exposes strong supply absorption by buyers.
Bar 49: Acts as a climatic capitulation bar. Although it breaks local supports, it respects the critical $0.0505 zone and carves out the lower boundary of a descending wedge with bullish implications.
Bars 51 and 52: Bar 51 executes a double-bottom pattern against bar 49, trapping late sellers and sweeping their stop losses. Bar 52 validates the descending channel breakout with volume exceeding the 20-period moving average.
Bar 53 (Current): Tests immediate resistance at $0.0557, measuring the bulls’ ability to sustain momentum toward the upper $0.0575 range.
Sky‘s price action shows that, despite cumulative bearish pressure across 54 bars, the formation of higher lows from the $0.03998 zone suggests underlying institutional accumulation. If buyers manage to overcome current resistance and consolidate above $0.0575, the path remains open to challenge the critical $0.0645 node, redefining the medium-term structure.
Disclaimer: This analysis is for educational and informational purposes only and does not constitute financial, legal, or investment advice. Crypto trading carries a high level of risk and may not be suitable for all investors. Always perform your own research before committing capital to the markets.

Communications Professional. Crypto Enthusiast. Economic Journalist. Bitcoiner & Altcoiner.


