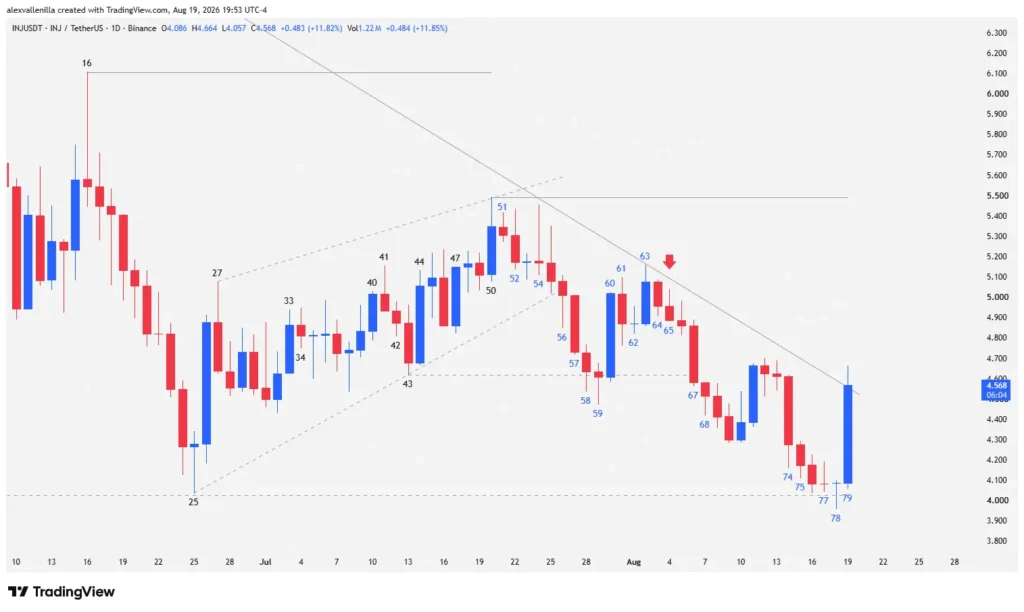
Injective (INJ) shows clear signs of exhaustion within its contraction structure. Following a prolonged sequence of lower highs that has kept the asset under pressure inside a 888-bar macro downtrend, recent daily price action hints at an order flow shift. Buyers absorbed supply at the critical $4,027 support zone and responded with a strong conviction candle that pierces the descending trendline, sparking debate over whether we are seeing the start of a consolidation range or the final floor of the correction.
The Path to Capitulation: Bull Traps and Local Support Breaks
Previous bullish momentum lost traction at Bar 50 near the key $5.49 resistance. Bar 51 posted a bearish consolidation that signaled a lack of follow-through, followed by Bar 52, which confirmed the pullback. At Bar 54, buyers attempted to regain control, but a pin bar forming a lower high relative to Bar 50 created a local double top pattern. The long upper wick of this candle exposed aggressive defensive pressure from bears.
The structural breakdown began between Bar 56 and Bar 57. Although Bar 56 acted temporarily as a hammer by absorbing supply beneath a secondary 31-bar ascending trendline, Bar 57 sealed the breakdown of both that trendline and an ascending wedge. This wide-range candle closed near its lows with minimal wicks and a slight volume increase, reflecting persistent sell flow from start to finish.
Local support at $4,617 (Bar 43 low) became the next battlefield:
Bar 58: Pierced the $4,617 level, but price failed to close below it, shrinking its body compared to the previous candle.
Bar 59: Made a second breakdown attempt. It printed a tiny body with a prominent lower wick—a sign of supply absorption and overlap inside Bar 58’s range. The sellers’ consecutive failure triggered an immediate bullish reaction.
Bar 60: Bulls pushed a high-conviction candle backed by high volume that took out the highs of the previous three bars, defending the momentum originating from Bar 25.
Technical Analysis: Low2 Trigger and the Response on Bar 79
Despite the strength shown in Bar 60, momentum dissipated quickly. Bar 61 pulled back, Bar 62 consolidated price via an inside doji, and Bar 63 exposed weak demand with a low-volume candle that barely cleared Bar 61’s high. The high of Bar 63 served as the anchor to draw the 79-bar descending trendline from the Bar 2 high.
The bull trap at Bar 64 (bearish inside bar) preceded Bar 65, which broke the prior low and set up a high-probability Low2 short setup within the secondary trend. Bar 66 executed the entry by breaking Bar 65’s low, leading to Bar 67—a wickless bearish marubozu that crushed the $4,617 zone. Bar 68 confirmed the breakdown with a lower close, invalidating the bullish structure and projecting a two-leg measured move down.
Deceleration and Buyer Capitulation in the $4,027 Zone
The leg down extended to test historical support at the Bar 25 low ($4,027):
Bars 74 to 77: Bar 74 printed high volume but left a notable lower tail. Bars 75, 76, and the Bar 77 doji showed shrinking bodies that failed to test $4,027 directly, confirming a clear loss of downside inertia.
Bar 78: A doji with a prominent lower wick slightly undercut $4,027, but supply lacked the strength to force a close below it.
Bar 79: Represents institutional demand stepping in. Buyers printed a wide-range, full-bodied candle closing above the 79-bar descending trendline. Accompanied by massive volume, Bar 79 sets up a potential double bottom pattern against Bar 25.
Market Dynamics and Forward Scenarios
The broader context reflects a dominant 888-bar downtrend where Bar 1 acted as a bull trap. Within the recent leg down from Bar 51, upside reversals remain sporadic (such as the naked candles on Bar 60 and Bar 79), while sell-offs required longer sequences of candles.
If bulls generate follow-through on Bar 79, they will confirm the break of the 79-period trendline. The next resistance target sits at the Bar 51 high ($5.49). Reclaiming and consolidating above $5.49 would invalidate the intermediate bearish structure. If price suffers a rejection at that level, INJ will enter a sideways consolidation phase between $5.49 and $4,027. Conversely, if Bar 79 fails to find follow-through and drops back below $4,027, the path opens toward the next key support at $3,422.
Injective‘s Crossroads
Injective’s price action highlights the fragility of breakouts lacking follow-through volume. While the higher-timeframe structure retains a bearish bias, the absorption around $4,027 and the aggressive response on Bar 79 temporarily restore market balance, requiring confirmation over coming sessions to validate a true trend change.
Disclaimer: The content in this article is for informational and educational purposes only and should not be construed as investment advice, financial advice, or a trading recommendation. Cryptocurrencies are high-volatility assets. Do your own research (DYOR) before making financial decisions.

Communications Professional. Crypto Enthusiast. Economic Journalist. Bitcoiner & Altcoiner.