Smart money in the digital asset market has taken control on the PAX Gold (PAXG) daily chart. After validating a solid floor at $3,959 and neutralizing a dominant 70-period bearish structure, the physical gold-backed token is consolidating a new bullish dynamic. Buying pressure, backed by volume exceeding the 20-day moving average, firmly invalidated sellers’ attempts, trapping short positions and confirming a polarity flip at strategic technical levels.
Market Structure: Institutional Breakout and Support Validation
The daily chart projects the formation of a new medium-term bullish structure, accumulating 16 bars of development since the low recorded at bar 41. Price action precisely validated the $4,197 level (bar 13 high), turning former resistance into primary support. This role reversal confirms the breakout above the last relevant pivot of the prior downtrend.
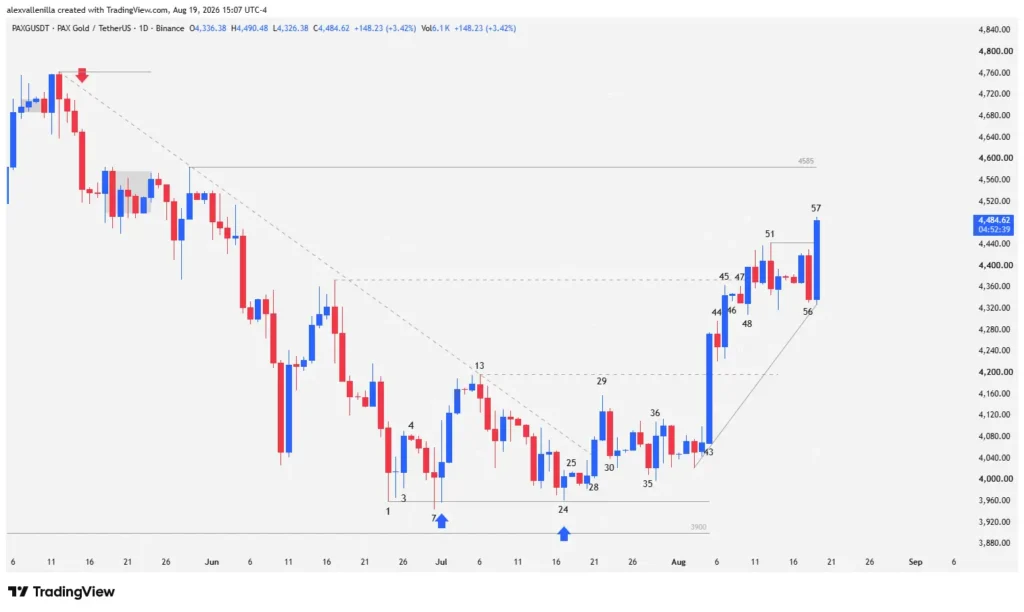
Order flow currently demonstrates price behavior where demand immediately absorbs every downside pullback attempt. The emerging uptrend line offers dynamic support near $4,320, while the $4,200 level acts as the second line of defense for buyers.
Technical Price Action Analysis (Bar-by-Bar)
Detailed analysis of the daily chart reveals market participant psychology and order flow behavior across the recent sequence:
Bar 43: Strong institutional momentum with high conviction and expanding volume triggers the upside breakout, establishing buyer dominance.
Bar 44: Bears attempt a pullback following the bar 43 expansion. However, bar 44 prints a narrow range with upper and lower tails. The close above its body invalidates selling pressure and generates a pullback failure, attracting fresh demand.
Bar 45: Prints bullish conviction and confirms the breakout above the bar 44 high. Volume supports the move while early shorts hit their stop losses, accelerating momentum. However, the bar stalls just short of testing key resistance at $4,373.
Bar 46 and Bar 47: Bar 46 develops as an inside consolidation pattern. Subsequently, bar 47 presents an outside bar with a very tight range that attempts to reject the resistance zone, but lacks continuation strength.
Bar 48: Buyers burst through with a wide-range bar featuring no upper tail. Buy orders flow continuously through the close, driving a decisive breakout above the $4,373 resistance.
Bar 51: Following two congestion bars (bars 49 and 50), bar 51 acts as an outside bar with a bearish body and upper tail, establishing local resistance at $4,442 and forming a bull flag. Although it hints at a correction, it lacks strong conviction since it fails to cover the full range of the previous bar. Bar 52 confirms the lack of bearish follow-through.
Bar 56: Bears attempt an aggressive counterattack via an outside conviction bar with minimal tails. Despite threatening the structure, the move logs markedly low volume, betraying a lack of institutional participation.
Bar 57: Smart money enters the market, driving a strong high-conviction bullish outside bar with a minimal lower tail. Bar 57 traps the sellers from bar 56 and breaks the bull flag resistance at $4,442.
The confirmed close of bar 57 above $4,442 clears the path to test the next resistance at $4,585. Additionally, the measured move projection from the bar 41 low to the bar 51 high sets a technical target in the $4,800 zone for the second leg up. This level aligns with the price magnet located at $4,870, corresponding to the last major swing high of the previous downtrend.
On-Chain Gold Maturity
Price action in PAXG demonstrates how institutional capital leverages tokenized market liquidity to position in safe-haven assets. The systematic invalidation of sell patterns and the absorption of supply confirm that tokenized gold is building a rock-solid technical structure, placing it in a prime position to pursue new highs in coming sessions.
Disclaimer: This article is strictly for informational and educational purposes. The information and technical analysis presented do not constitute investment advice, financial advice, or a solicitation to buy or sell digital or tokenized assets. Cryptocurrency and token markets carry high volatility; perform your own due diligence before making any financial decisions.

Communications Professional. Crypto Enthusiast. Economic Journalist. Bitcoiner & Altcoiner.