

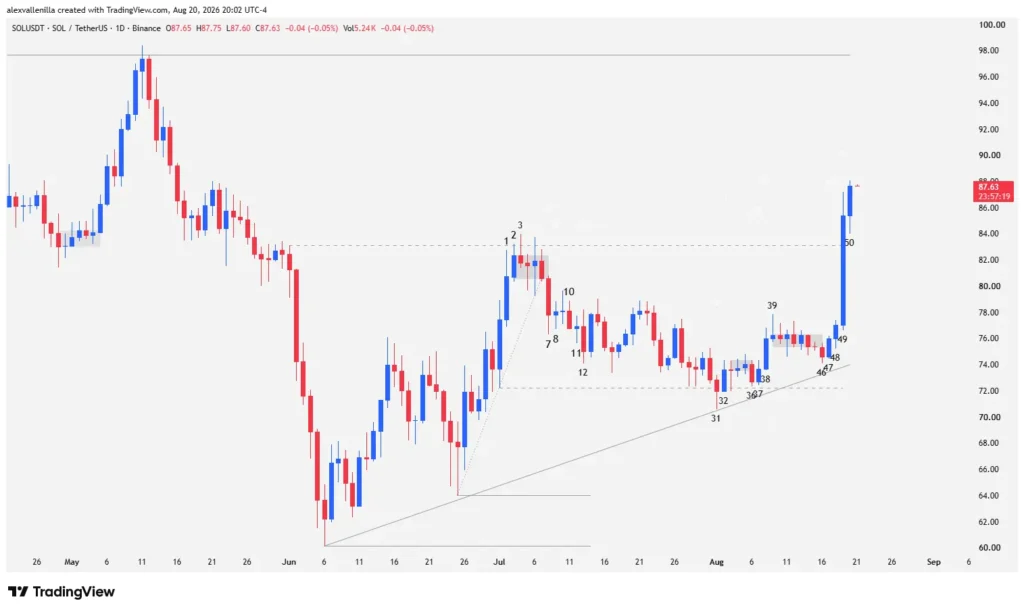
Solana (SOL) price made a decisive move on the daily timeframe after breaking above the key $83.10 resistance level. Backed by trading volume that doubled its 20-day moving average, the asset liquidated selling pressure at $72.25. This price action opens the door toward the technical target of $97.68, which could redefine the cryptocurrency’s macro structure.
Market Structure: Two-Legged Pullback and the Range Battle
SOL‘s operational context shows a significant bounce starting from the dynamic floor at $60.13. This bullish move developed a two-legged pullback structure that culminated at Bar 3, where sellers aggressively defended the local resistance at $83.10. This level previously served as a resting zone after a steep bearish push that caught buyers in a bull trap.
During subsequent sessions, price action compressed inside a sideways range defined by $83.10 resistance and $72.25 support. Within this range, supply attempted to take control of the market on multiple occasions; however, demand defended the trendline by printing higher lows on the 75-bar timeframe.
Candlestick Reading and Order Flow: Anatomy of the Breakout
A micro reading of the Japanese candlesticks details the transfer of liquidity from weak hands to institutional traders:
Bar 31: Supply managed to briefly pierce the local $72.25 support, but lack of follow-through and declining volume signaled low conviction. The lower wick formed a structural anchor to draw a 75-bar bullish trendline.
Bar 32: Buyers reacted by printing a reversal pattern. By breaking above the high of Bar 31, the market confirmed the failed support breakout.
Bars 36 & 37: Bears made another attempt to pierce the $72.25 zone via Bar 36. However, Bar 37 acted as an inside bar with a bullish close, trapping sellers in a second consecutive failure. In price action theory, when the market fails twice to execute an objective, opposing pressure typically takes full control.
Bar 38: Smart money validated the reversal by closing strong above the high of Bar 37.
Bars 39 to 46: Price printed a pin bar (inverted hammer) at Bar 39, starting a congestion phase with a barb wire pattern. Despite the stall, Bar 46 printed a higher low while respecting the 75-bar trendline and the defensive $72.25 zone.
Bars 47 & 48: Bar 47 trapped late sellers from Bar 46, while Bar 48 confirmed the continuation of the bullish turn.
Bar 49: Institutional volatility exploded. SOL printed a high-conviction marubozu candle with a 10.81% move, covering almost its entire daily range. It decisively broke through the $83.10 resistance backed by trading volume that doubled the 20-period moving average.
Bar 50: The current candle confirms the technical breakout by trading above the high of Bar 49. Although displaying a narrower range, sustained volume validates price acceptance at higher levels.
Technical Outlook: Targets and Invalidation Zones
The current move consolidates a counter-trend bullish channel on the daily chart. If demand holds price above $83.10, the structure points toward testing major resistance at $97.68.
Clearing $97.68 would be decisive, as it would invalidate the primary bearish structure dominating the asset over the last 336 bars. Conversely, if price faces rejection in that zone, key operational support levels to watch are $83.10 (prior resistance turned support) and dynamic trendline support, currently located at $73.90.
Market Significance
Repeated failure by supply to break below $72.25 triggered a short squeeze backed by institutional volume on Bar 49. This resistance breakout shifts the short-term technical structure and positions Solana at a critical phase to neutralize its macro downtrend.
Disclaimer: This analysis is strictly for informational and educational purposes based on price action methodologies. It does not constitute investment advice or a financial recommendation. Every trader should do their own research (DYOR) and manage risk responsibly.

Communications Professional. Crypto Enthusiast. Economic Journalist. Bitcoiner & Altcoiner.


