

A classic two-leg corrective move to the upside in Solana (SOL) hit an impenetrable wall at key resistance of $83.10. What started as a solid recovery attempt within a long-term bearish structure turned into a congestion and rejection scenario. After failing to consolidate the breakout, sell-order flow took temporary control, pushing the price toward the 20-period exponential moving average (20 EMA) and trapping late buyers who entered due to FOMO (fear of missing out).
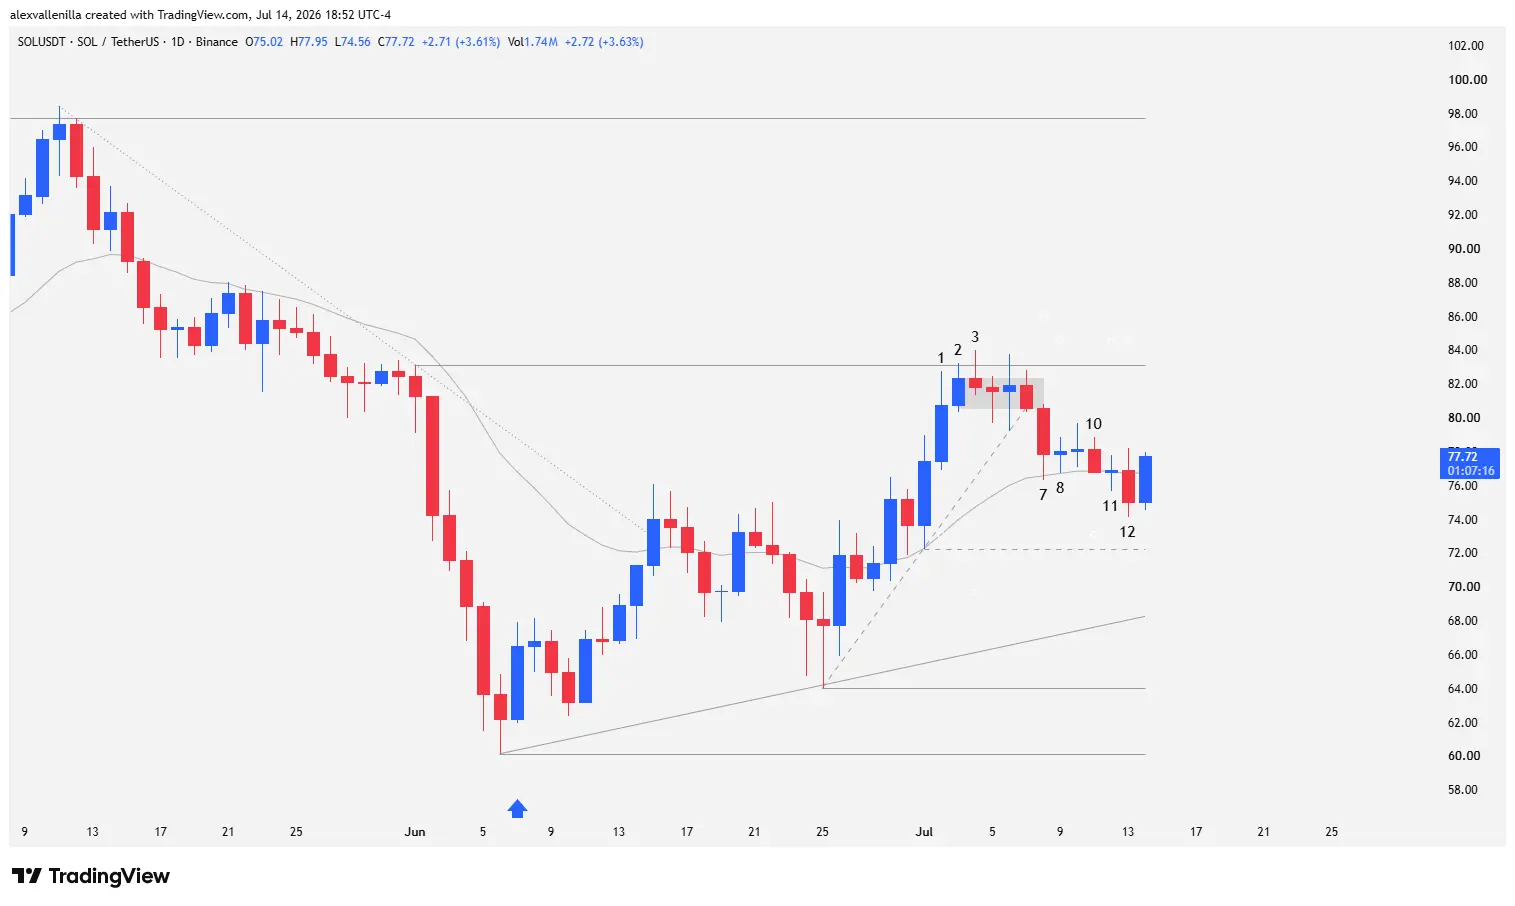
Currently, short-term traders are closely watching the local support zone at $72.25. Defending this level will determine whether Solana retains enough fuel for a second attack on recent highs or resumes its primary downtrend to search for new lows.
Anatomy of the Rejection: Price Slams into the $83.10 Wall
Solana’s recent rebound—technically structured in a two-leg upward cycle over the last 38 bars—culminated in a notable loss of momentum. Bulls attempted to challenge the $83.10 resistance, a level that coincides with the point of control of a minor bearish microchannel from the previous 35 bars. However, price action near the highs revealed that sellers quickly absorbed the demand.
Continuous overlapping of trading ranges near this historical resistance generated a minor congestion range. This accumulation of orders without an upside resolution ended with a bearish breakout that is now dragging the price to interact directly with the 20 EMA, a key indicator to gauge the health of the immediate trend.
Technical Analysis: Bar-by-Bar Price Action Reading (1D Chart)
The daily chart structure reveals a clear transition from driving momentum to absolute buyer exhaustion at the top of the range.
Bar 1: Continues the momentum of the second leg up. However, the effort falls short, and the session high fails to test the technical resistance at $83.10.
Bar 2: This small bullish candle attempts to break above $83.10 but fails immediately, closing below the mark. Its tiny body is completely overlapped within the range of Bar 1, confirming a deceleration pattern (since the body of the bar preceding Bar 1 was significantly larger).
Bar 3: Sets up as a pinbar-style pullback (rejection candle). Buyers tried to break resistance again, but bears absorbed the demand, forcing a close at the bottom of the range. This bar’s high marks the definitive end of the second leg up.
Bars 4, 5, and 6: Overlapping with Bar 2 continues, consolidating a tight congestion range just below the resistance level due to the absence of a catalyst to validate a breakout.
Bar 7: Bears aggressively break out of the tight range to the downside, also snapping the second leg’s microchannel. Although the low temporarily pierces the 20 EMA, the session closes above it. This candle acts as a Low 2 short setup bar. Within the short-term 38-bar view, it represents a countertrend move, but through the macro bearish lens of the last 300 bars, it confirms that Bars 2 and 3 constituted a classic bull trap.
Bar 8: An inside doji candle. The lack of follow-through from Bar 7’s drop fails to immediately trigger pending sell orders below its low.
Bar 10: Represents a new pullback after two doji sessions highlighted the bulls’ inability to regain momentum. This bar manages to close slightly below the 20 EMA.
Bar 11: Another doji whose low breaks the previous structure but lacks decisive bearish follow-through.
Bar 12: Market volatility increases with a strong bearish outside bar close. Despite the pressure, the session low respects local support at $72.25, which represents the point of control of the second leg’s last push.
Current Bar (Developing): Solana posts an intraday recovery of over 3% and trades at $77. A bullish inside candle is forming, temporarily halting Bar 12’s bearish momentum and keeping critical support at $72.25 safe.
Projective Scenarios: Escape Routes for SOL
Solana’s immediate fate will be decided by how the current battle between local support and the $83.10 resistance resolves.
Bearish Scenario: Loss of Key Support Levels
If the current bounce from the developing candle fails and the price loses support at $72.25, bears will aim to capitulate the structure. The next target is dynamic support at $68.25, where the 38-day ascending trendline converges. If this line gives way, price will inevitably seek $64.04, the origin of the bullish impulse, completing a full reversal of the corrective move.
Bullish Scenario: Defending Support and Structural Attack
If buyers successfully consolidate their defense of $72.25 and reclaim the 20 EMA, the market will launch a second attempt at the $83.10 resistance. A successful breakout above this level would clear a technical path toward $97.68. This is the most crucial structural resistance on the long-term chart; breaking it would mark the first firm step toward reversing the primary downtrend.
Price action in Solana proves that two-leg moves exhausting their momentum at key resistance levels typically trigger deep pullbacks. For now, support at $72.25 acts as the bulls’ last line of defense. If they fail to hold it, the macro bearish structure will regain absolute control of the asset.
Disclaimer: This analysis is for informational and educational purposes only. It does not constitute financial advice, an investment recommendation, or an offer to buy or sell digital assets. Cryptocurrencies are highly volatile assets; perform your own research before committing capital.

Communications Professional. Crypto Enthusiast. Economic Journalist. Bitcoiner & Altcoiner.


