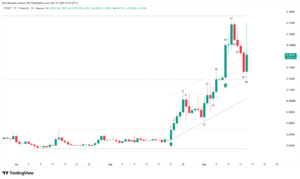
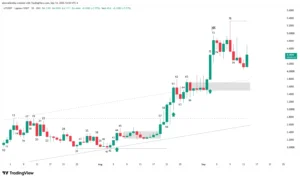
During recent sessions on the daily chart, the price of Solana (SOL) stages a violent bullish impulse led by institutional buyers. This movement manages to breach the $98 structural resistance and breaks a 336-bar bear trendline, marking a potential structural trend shift that redefines the landscape for digital asset investors.
Anatomy of a Historic Breakout on the Daily Chart
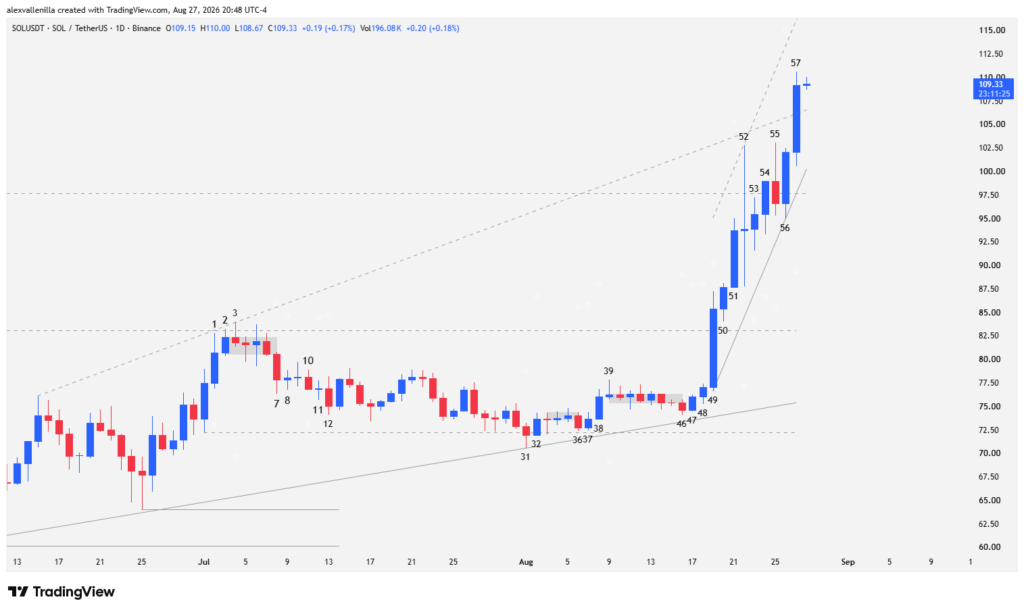
The crypto ecosystem closely watches price action on Solana’s daily chart. Following a prolonged accumulation phase spanning from bar 1 to bar 49, the market triggers a massive buying response. Bar 50 acts as a bullish continuation pattern (High 2) within an 82-bar trendline, paving the way for an unprecedented technical breakout in over a year of a bear cycle.
Technical Analysis: Bar Reading and Order Flow
Bar 51 acts as the primary catalyst for this impulse. This high-conviction bullish formation lacks a lower tail, demonstrating that buy-side order flow dominates the market from the open, backed by trading volume well above average. The price breaks and closes comfortably above the previous bull channel, generating a clear overshooting.
Volatility explodes on Bar 52, which prints a wide-range doji. Its high pierces the $98 structural resistance and attempts to reach the top of an expanding ascending wedge, a movement framed within a nine-bar micro-channel. This milestone marks the first time in 336 bars that the price surpasses resistance of this magnitude, invalidating the previous bearish structure.
Following a corrective pause on Bar 53 (an inside bar with collapsing volatility), the bulls regain control on Bar 54, closing above $98 once again. Although Bar 55 attempts a pullback with a long upper tail driven by profit-taking, the bears fail as they cannot break the previous low.
The institutional response arrives on Bar 56, a high-conviction candle that successfully defends the new $98 support (polarity switch). This downside rejection traps premature sellers, fueling Bar 57, which doubles the 20-day average volume and accelerates price within a tight channel.
Key Levels and Market Outlook
The current bullish impulse responds to runaway bull dynamics, where shallow pullbacks serve as fuel to liquidate short positions. Operational levels to watch structure as follows:
Primary Support: $98 (former resistance turned support via polarity inversion).
Secondary Support: $83.
Next Bullish Target: $122, a level conditioned by historic polarity-shift resistance.
The price currently experiences a third push within an accelerated structure, demanding caution regarding a potential buyer exhaustion phase or a lateral consolidation phase before seeking a solid second leg up.
Solana‘s price action demonstrates that the multi-year bearish structure is officially compromised. Institutional defense of the $98 level and the surpassing of previous highs configure a pre-bullish scenario that forces traders to reassess their portfolios through a lens of renewed technical optimism.
Disclaimer: This article is for educational and informational purposes only. It does not constitute financial or investment advice. The cryptocurrency market operates with high volatility; conduct your own research before executing trades.

Communications Professional. Crypto Enthusiast. Economic Journalist. Bitcoiner & Altcoiner.