The digital asset market registers a drastic bias shift. Bitcoin (BTC) executed a powerful bullish impulse on the daily chart, backed by a surge in institutional buy order flow. This move invalidated the 305-bar bearish structure and positioned the cryptocurrency in a critical zone to confirm a macro trend reversal.
The Institutional Impulse That Broke the Sideways Range
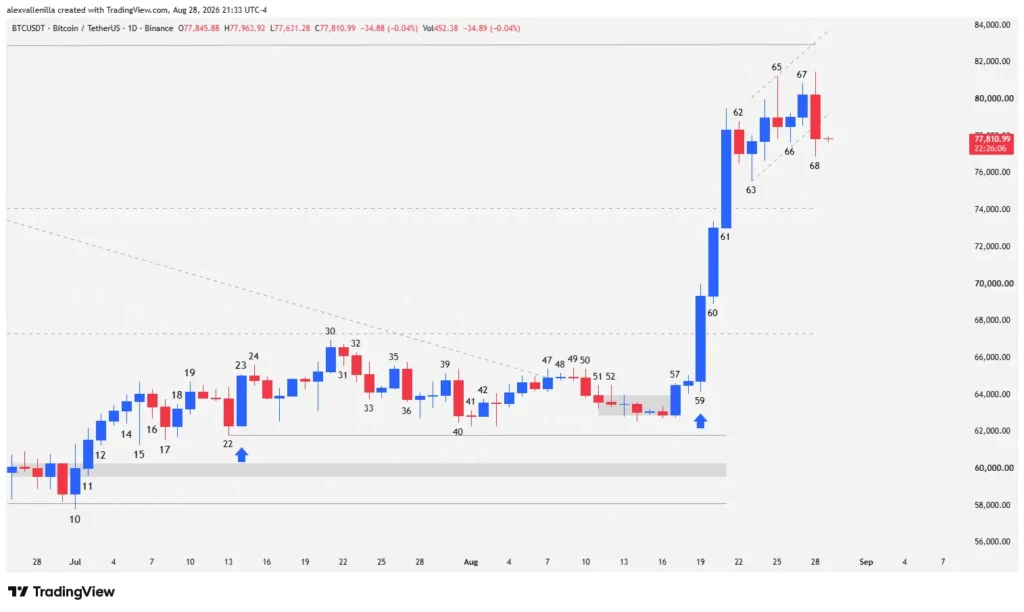
Buy-side pressure grabbed total control of the order book following consolidation above structural support at $58,100—a level previously validated by a double bottom pattern (bars 4 and 10) and confirmed with higher lows on bars 22 and 57.
Daily Price Action Analysis
Bar 59: Bulls decisively broke through key resistance at $67,300, which defined the ceiling of the prior sideways range. This high-conviction bar surged 7.12% during the session, registering trading volume double its 20-day moving average and reaching a high not seen in 65 bars. Roughly 50% of the candle body closed above the breakout level, confirming breakout validity and ratifying the buy signal generated on bar 23.
Bar 60: Institutional capital maintained buying pressure. The session closed up 5.32% supported by substantial volume, though the top of the bar fell short of testing local resistance at $74,000.
Bar 61: This candle featured a shaved bottom—a signal that buyers took the initiative right from the session open. Bulls cleanly broke through $74,000 resistance, leaving over half of its body above the level while displaying only a minor upper wick. This marked the third consecutive supply-absorption event.
Bar 62: A consolidation bar with a bearish body appeared, initiating a healthy pullback following the nearly vertical advance of the previous three sessions.
Bar 63: Buyers defended the $74,000 level—now acting as operational support—printing a small hammer that halted the pullback’s momentum.
Bar 65: Volatility returned to the market. This bar printed a inverted hammer with a bearish body and a prominent upper shadow, signaling profit-taking by supply at elevated levels. Bar 66 temporarily negated seller strength, marking a failed pullback, but the high of bar 65 served as an anchor to project the upper boundary of a bull flag pattern.
Bar 67: Bulls displayed momentum exhaustion by printing a low-conviction candle that failed to test the prior high.
Bar 68: A bearish outside bar emerged, completely engulfing bar 67 and closing below its low, piercing the lower boundary of the bull flag. Shadows on both ends reveal a fierce battle between buyers and sellers. Accompanied by a volume spike above the 20-day average, this candle at the top of an impulse warns of potential distribution or a short-term bias shift.
Execution Scenarios and Price Projections
The current technical structure puts price at a crucial juncture. A definitive breakout above $74,000 resistance clears the path to attack structural resistance at $82,850—the final key high of the 305-bar macro downtrend. Clearing that level projects a measured move target into the $94,500 zone.
If bears manage to break key support at $74,000, downside risk escalates substantially, driving BTC toward prior support at $67,300 and threatening to turn the recent surge into a bull trap.
Bitcoin demonstrated the strength required to reverse long-term bearish structures, but emerging volatility and lack of follow-through at the highs demand caution. Market reaction around $74,000 will determine whether price consolidates a new uptrend or yields to selling pressure.
Disclaimer: This analysis is strictly for informational and educational purposes and does not constitute investment advice or a financial recommendation.

Communications Professional. Crypto Enthusiast. Economic Journalist. Bitcoiner & Altcoiner.