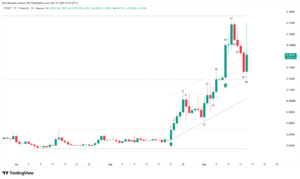
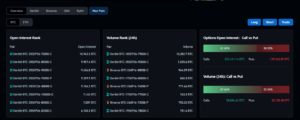
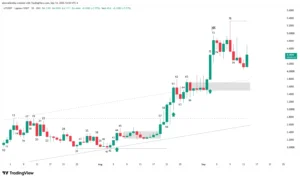
Financial markets rarely change direction overnight; instead, they build transitions through friction, structural breakouts, and pitched battles between bears and bulls. Mantle (MNT) currently stars in one of these critical transitions on its daily chart, shifting from a long-term macro bearish structure toward a new paradigm of higher lows and higher highs. With the price flirting dangerously with the key resistance at 0.5948, the token tests the conviction of institutional buyers.
From Accumulation to Change of Character
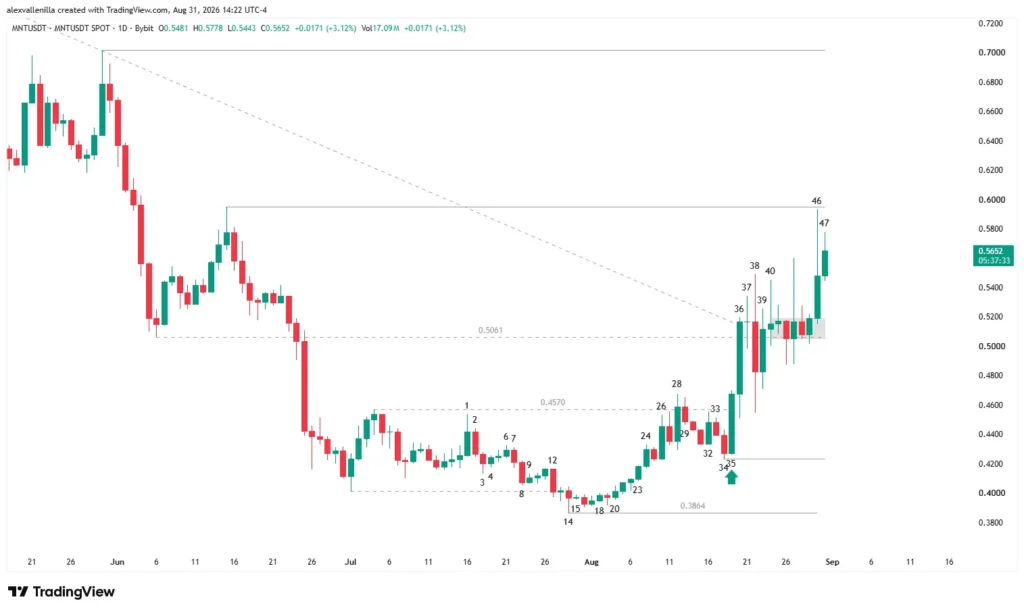
Mantle’s evolution demonstrates how price action anticipates fundamental pivots long before retail investors react. After marking a significant low at the bottom of Bar 4 ($0.3864), the token structured a solid sequence of rising lows at Bar 34 ($0.4232) and Bar 45 ($0.5018).
The operational turning point hit at Bar 36, when the price decisively broke the secondary bear trendline that spanned 156 bars. This breakout was not an isolated event: Bar 35 preceded it with an immaculate bull trend bar featuring no lower shadow and backing from institutional volume that doubled the 20-period moving average. This classic Bull Surprise behavior completely altered the order flow, transforming prior liquidity and forcing short sellers to rethink their positions.
Price Radiography: Bar-by-Bar Technical Analysis
Millimetric analysis of recent sessions reveals a fierce struggle for control over value. Following the initial bullish impulse, Bar 38 reflected extreme volatility expansion via a bearish outside bar, followed by a barbed wire congestion pattern between Bar 39 and Bar 40 that drastically reduced traded volume.
This precarious balance broke with the appearance of Bar 46, which completed a second leg up from the impulse originating at Bar 35 and directly tested the major resistance located at $0.5948. However, Bar 46 left a wide upper wick. This formation evidences that institutional sellers actively defend that technical reference and that faster investors execute partial profit-taking.
Currently, Bar 47 operates as an inside-type day pause or consolidation. Pullbacks remain shallow and bulls retain control, as the price has not given back the range of the previous momentum candles. For bears to regain dominance, the market requires a large bear trend bar that completely negates the trading range of Bar 46.
Projections and Operational Action Plan
Technical development suggests two distinct scenarios for upcoming sessions:
Bullish Scenario: Buying pressure absorbs accumulated supply in the $0.5948 zone. If a bar closes solidly above this threshold, the macro bear structure becomes invalidated, projecting the price toward the next relevant technical target at $0.7015. Traders manage the logical entry via a Buy Stop order placed slightly above the high of Bar 46, protecting the position with a structural Stop Loss below the consolidation support ($0.5018).
Bearish Scenario: Rejection at $0.5948 intensifies and Bar 47 generates bearish continuation. In this case, the asset seeks liquidity at the confluence of the $0.5061 horizontal support and the 156-bar trendline converted into dynamic support (polarity), offering a deep pullback before attempting a new bounce.
The breakdown of macroscopic structures defines itself not by temporary euphoria, but by the price capacity to sustain institutional acceptance levels. Monitor volume behavior closely at $0.5948.
Disclaimer: This article serves educational and informational purposes only. It does not constitute financial, legal, or crypto asset investment advice. Cryptocurrency trading carries a high risk of capital loss; you trade at your own risk.

Communications Professional. Crypto Enthusiast. Economic Journalist. Bitcoiner & Altcoiner.