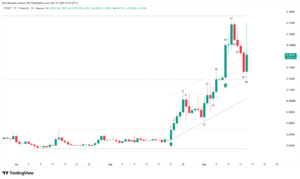
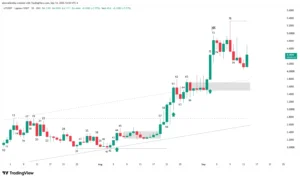
Skycoin (SKYUSDT) breaks a prolonged bearish regime on its daily chart after completing a descending wedge and pushing past the key $0.0645 resistance level. This structural shift, backed by institutional price action and recent volatility compression, projects a bullish continuation scenario with a technical target set at $0.0900, transforming the landscape for investors focused on high financial technology.
Regime Transition and the End of Selling Pressure
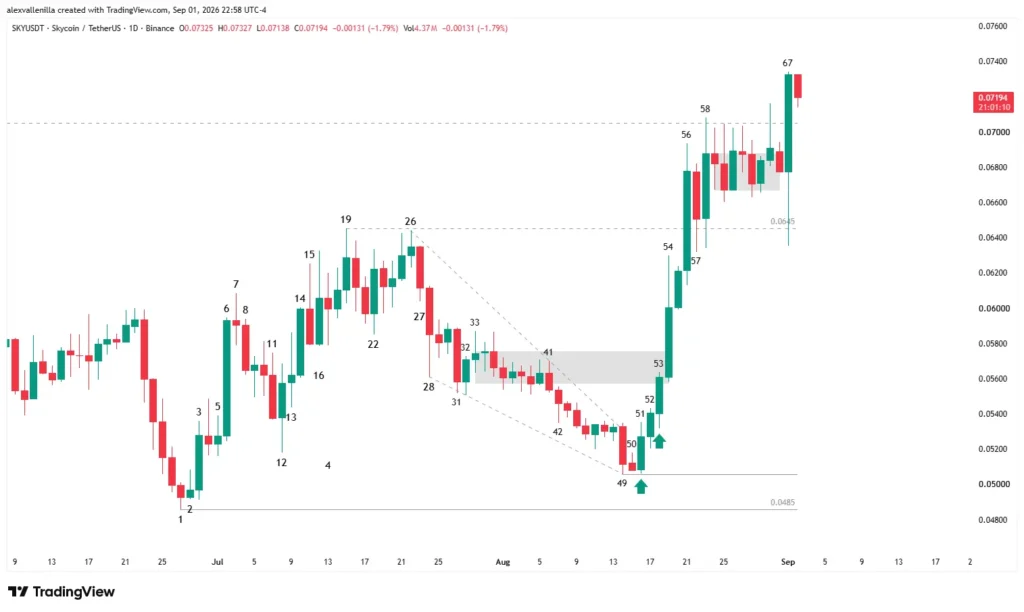
The digital asset ecosystem witnesses a technical metamorphosis in Skycoin’s price action. After dragging down a wide descending channel that limited its valuation, the asset completes a descending wedge compression pattern. Bar 49 seals a higher low relative to the pattern’s start at Bar 1, decisively invalidating seller dominance.
This dynamic pivot triggers an immediate response from institutional order flow. Buyers seize on the exhaustion of supply to carve out a tight microchannel that pierces prior resistance levels, transforming supply zones into solid operational floors through the classic polarity switch principle.
Technical Analysis (Top Priority)
The rigorous bar-by-bar breakdown of price action reveals the psychology hidden behind recent volatility on the SKYUSDT daily chart:
Bar 53: Acts as a high-probability High 2 pattern, confirming the breakout of the descending wedge. Its wide bullish body demonstrates aggressive institutional defense of the lower support.
Bar 54: Extends the bullish momentum while driving up volatility. However, the presence of a prominent upper wick highlights partial profit-taking and the first defensive test of the $0.0645 resistance.
Bar 56: Operates as a massive impulsive breakout (Bull Surprise) that cleanly cuts through $0.0645. Because it forms the sixth consecutive narrow-range bullish bar, it technically functions as a climatic move, forcing the market to seek an immediate breather rather than an infinite expansion without prior consolidation.
Bars 57 and 58: Bar 57 executes a millimeter-precise internal pullback that validates the polarity switch above $0.0645. Immediately, Bar 58 negates any bearish intent with a pullback failure, containing buying pressure within a tight sideways band.
From the Tight Trading Range to the Bar 67 Breakout: Between bars 58 and 66, the chart prints a consolidated barbed wire pattern characterized by small bodies and constant overlaps. Bar 67 shatters this equilibrium via a wide-range outside bar backed by institutional volume.
Projections and Trading Strategy
The technical structure favors the primary bullish continuation scenario. Using a Measured Move projection based on the amplitude of the initial leg between Bar 50 and Bar 56, the technical target drives the quote directly to the $0.0900 macro resistance.
Entry Strategy: Taking positions on the break above the high following Bar 67.
Risk Management (Stop Loss): Structured strictly below the micro consolidation range at $0.0670, or conservatively protected beneath the main polarity switch support at $0.0645.
Alternative Scenario: If the Bar 67 breakout falters and turns into a Failed Breakout, the asset returns to sideways congestion, seeking firm demand exclusively at the lower dynamic support.
Overcoming congestion levels in Skycoin proves the utility of reading market psychology through Japanese candlesticks without relying on lagging indicators. The validation of institutional support at $0.0645 grants solidity to a market that now points with technical arguments toward the $0.0900 zone.
Disclaimer: This article is for educational and informational purposes only. It does not constitute financial advice or an investment recommendation. The crypto asset market presents high volatility and operational risk; every investor must conduct their own research before committing capital.

Communications Professional. Crypto Enthusiast. Economic Journalist. Bitcoiner & Altcoiner.