After a prolonged period of dormancy that kept investors on edge, Chainlink (LINK) finally seems to have found a solid floor. Following a breakout from a downtrend that dominated the chart for 214 bars, the asset entered a price rediscovery phase. Although Year-to-Date (YTD) performance still shows a 28.44% loss, the 12.39% monthly rally suggests that institutions and early adopters are positioning themselves for what is technically known as a cycle transition. The market is no longer just watching Chainlink’s interoperability technology, but rather the strength of its price structure in USD.
The End of Bearish Hegemony: From Chaos to Accumulation
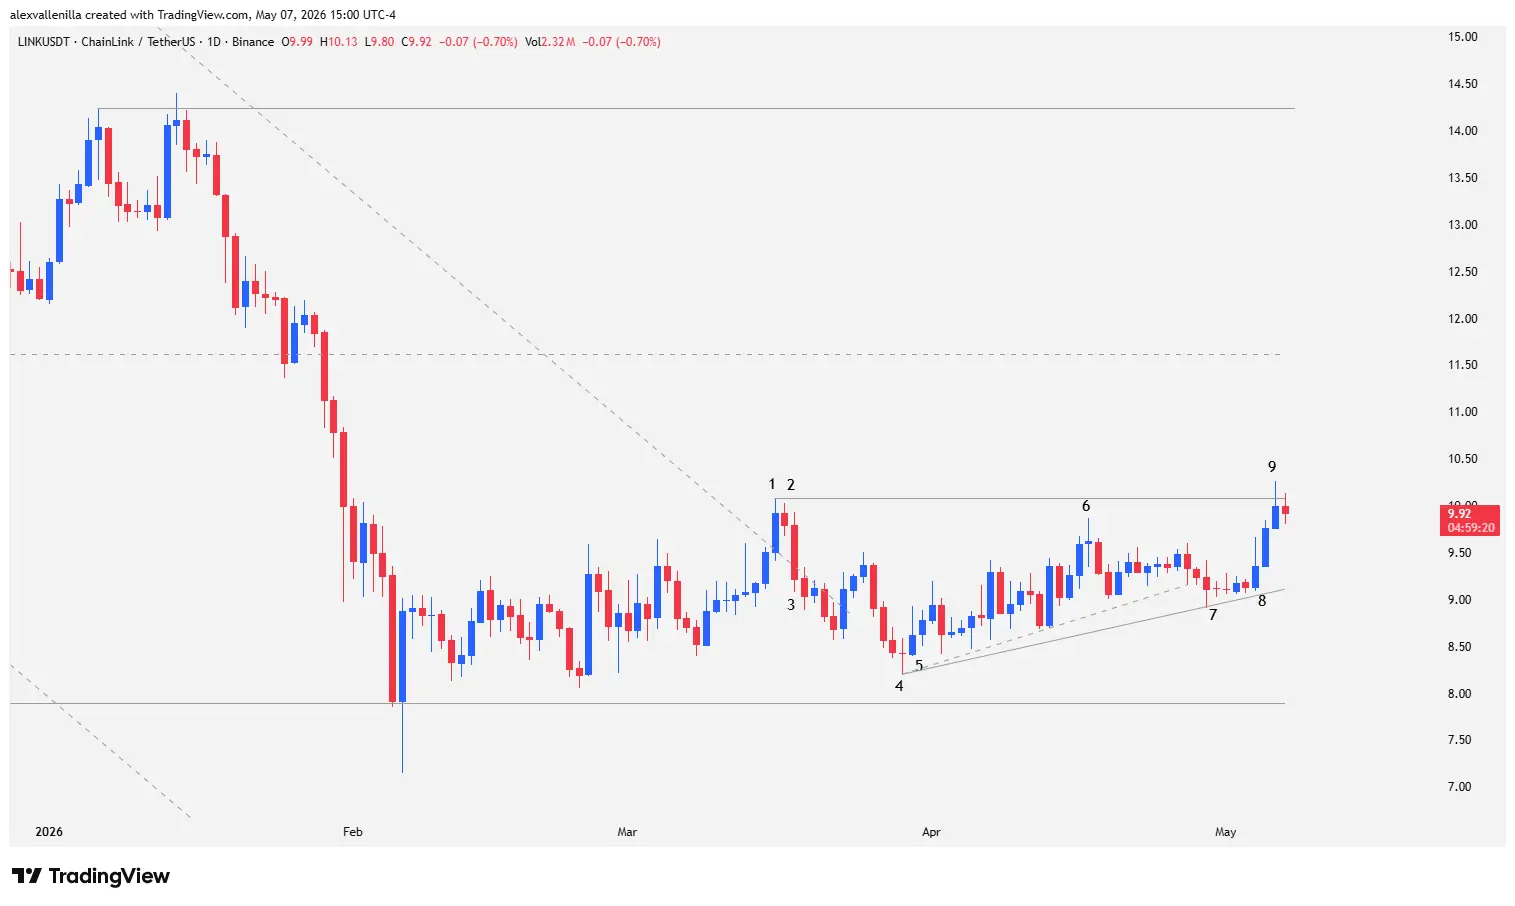
Chainlink left its freefall behind to enter a “Spike and Range” structure. This pattern is fundamental to understanding the shift in sentiment: after breaking the descending trendline, price didn’t skyrocket vertically. Instead, it began to move sideways, building the necessary base to absorb remaining selling pressure.
Currently, LINK is compressed between psychological support at $7.90 and immediate resistance at $10.08. This congestion zone is, in reality, a battlefield defining the token’s medium-term future. While the asset is down 18.93% so far in 2026, recent price action tells a story of resilience.
Technical Analysis: The Narrative of the Bars
For price action trading enthusiasts, the LINK daily chart presents a textbook sequence of events that explain the psychology behind every move:
Bar 1 and 2 (The Trap): Bar 1 was the breakout signal, snapping the 214-period downtrend and marking resistance at $10.08. However, Bar 2—an inside bar—failed to provide follow-through, revealing the market wasn’t quite ready for liftoff.
Bar 3 and 4 (The Stress Test): Bar 3 acted as a “bull trap,” aggressively re-entering the previous bearish zone. Panic pushed prices down in two legs to Bar 4, an indecision Doji that stalled just above key support at $7.90, showing supply was exhausting.
Bar 5 and 6 (Micro-Channel Construction): Bar 5 activated buyers, initiating a 29-bar bullish micro-channel. Although Bar 6 (a Doji with a long upper wick) showed bears defending the highs, the price began printing higher lows.
Bar 7 and 8 (Triangle Formation): Bar 7, despite being an outside bearish bar, served to anchor a 39-bar bullish trendline, setting up an Ascending Triangle. Bar 8 confirmed the reversal by closing above a four-day congestion, validating buyer strength.
Bar 9 (The Resistance Test): Finally, Bar 9 pierced the Bar 1 high ($10.08). While the close wasn’t higher, the test of the triangle’s upper bound indicates a buildup of tension that typically resolves with an explosive breakout.
The market magnet now sits at $14.24, the last major lower high of the previous downtrend. Clearing this level would not only erase yearly losses but confirm the start of a new long-term bull cycle. Chainlink is moving beyond being a technological promise to proving, bar by bar, its financial recovery capacity.
Disclaimer: This analysis is for educational purposes and does not constitute financial advice. Investing in digital assets carries high risk.
Communications Professional. Crypto Enthusiast. Economic Journalist. Bitcoiner & Altcoiner.