Following a climactic sell-off that shook the ecosystem’s foundations, Ethereum (ETH) successfully broke its 27-week bearish trend. Price action is currently printing a higher-low structure, attempting to solidify a narrative shift while buyers and sellers battle within a technical congestion range that will define the asset’s mid-term direction.
Awakening from Support: Price Action Analysis
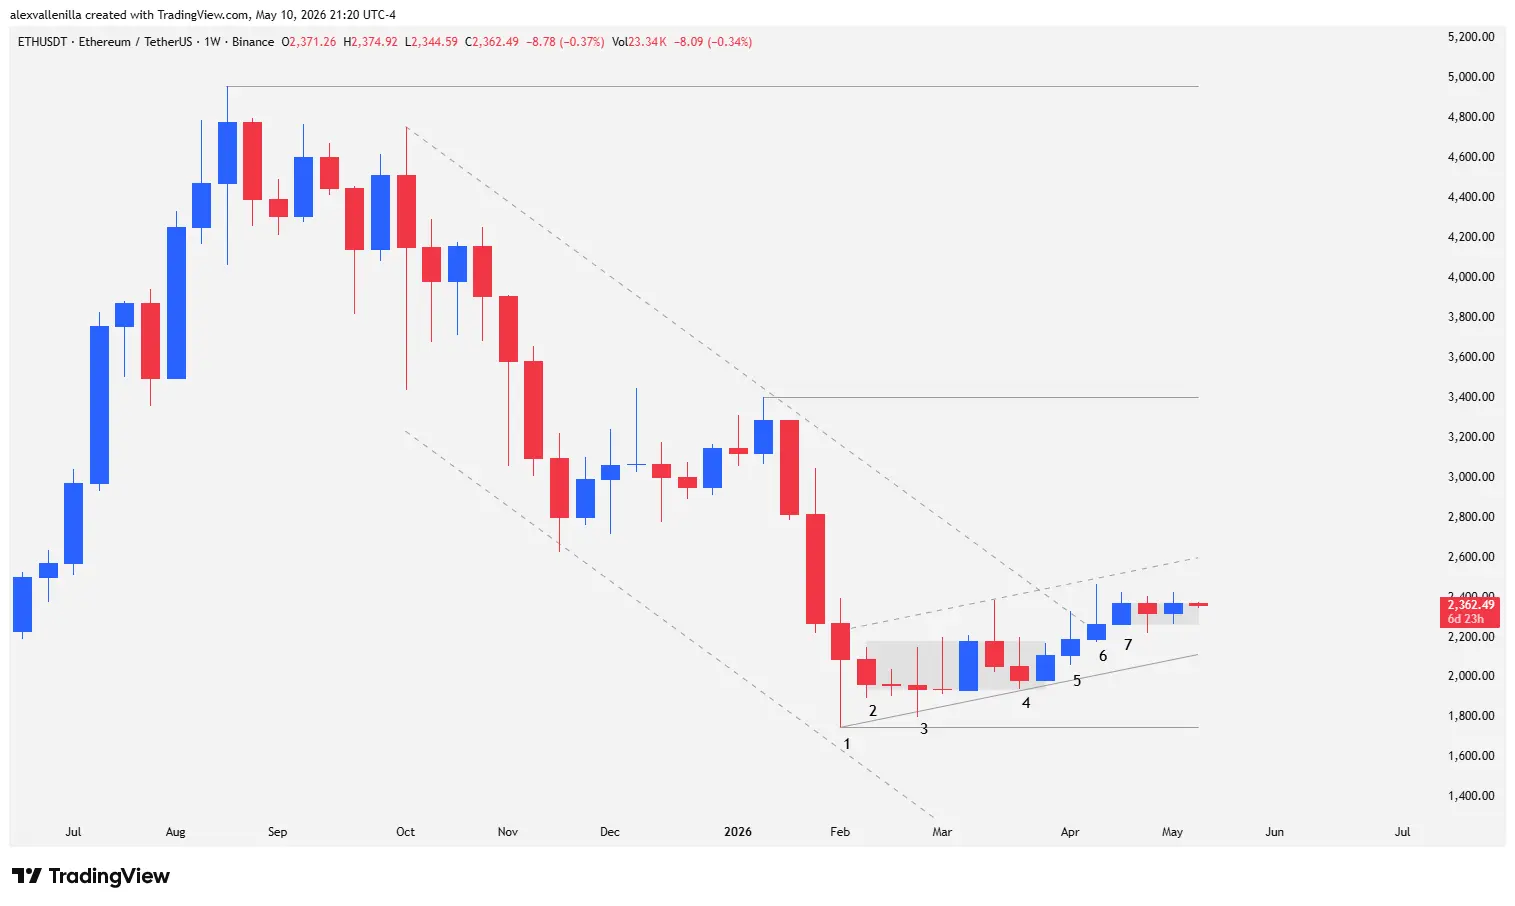
The Ethereum weekly chart reveals a 14-bar struggle that transformed capitulation sentiment into cautious accumulation. After completing a textbook bearish move with two extended legs, the asset found a solid floor at $1,750. This level did more than just stop the bleeding; it activated a counter-trend bullish microchannel that is currently challenging major dynamic resistances.
Technical Analysis: Bar Breakdown and Market Narrative
To understand ETH‘s future, we must examine the architecture of its recent movements:
Bar 1 (The Capitulation Floor): This session is fundamental. After a 19.41% drop, Bar 1 closed as a pinbar with a massive lower tail (twice the size of the body). This price action marked the end of a 27-week downtrend and established critical support at $1,750.
Bars 2 and 3 (Consolidation and Testing): Bar 2 acted as an inside bar, signaling the start of a seven-week congestion phase. Subsequently, Bar 3 (a doji) attempted to push lower but failed to even test the Bar 1 support, confirming the presence of active buyers.
Bar 4 (Bearish Failure): Bears attempted to regain control, but the Bar 4 low was higher than the Bar 3 low. The sellers’ inability to push price toward support attracted a new wave of demand.
Bars 5 and 6 (Trend Breakout): Bar 5 managed to close slightly above the previous congestion, though dynamic resistance still weighed heavy. Bar 6 finally broke the 27-week bearish trendline. However, its long upper tail warned that bears are still aggressively defending the resistance zone.
Bar 7 (Spike and Range Structure): Currently, Bar 7 appears as a small-bodied bullish inside bar. The lack of immediate follow-through suggests ETH is entering a “spike and range” pattern, a common transition phase before an expansive move.
The Roadmap: Key Levels for the Bull Run
Despite the trendline breakout, Ethereum has not yet claimed victory. Price is moving within a 14-bar bullish microchannel, but the strength between supply and demand appears balanced, pointing toward a prolonged accumulation process.
To confirm a genuine bull market, Ethereum must first clear the $2,600 resistance (the microchannel top). The true challenge, however, lies at $3,400. This is the last major lower high of the previous downtrend; breaking and consolidating above it would validate a new macro bullish structure.
Risk Scenarios
If price is rejected forcefully before reaching $3,400, we could be looking at a “bull trap.” In that case, the supports to watch are:
$2,100: The lower boundary of the current microchannel.
$1,750: The Bar 1 low. Losing this level would severely reactivate the bearish trend.
Ethereum has completed the hardest phase: stopping the freefall and breaking a half-year bearish inertia. However, volume and price action over the last three weeks suggest the market needs more time to digest supply before targeting new yearly highs.
Disclaimer: This analysis is for informational and educational purposes only. It does not constitute financial advice or investment recommendations. Cryptocurrencies are volatile assets; trade at your own risk.
Communications Professional. Crypto Enthusiast. Economic Journalist. Bitcoiner & Altcoiner.