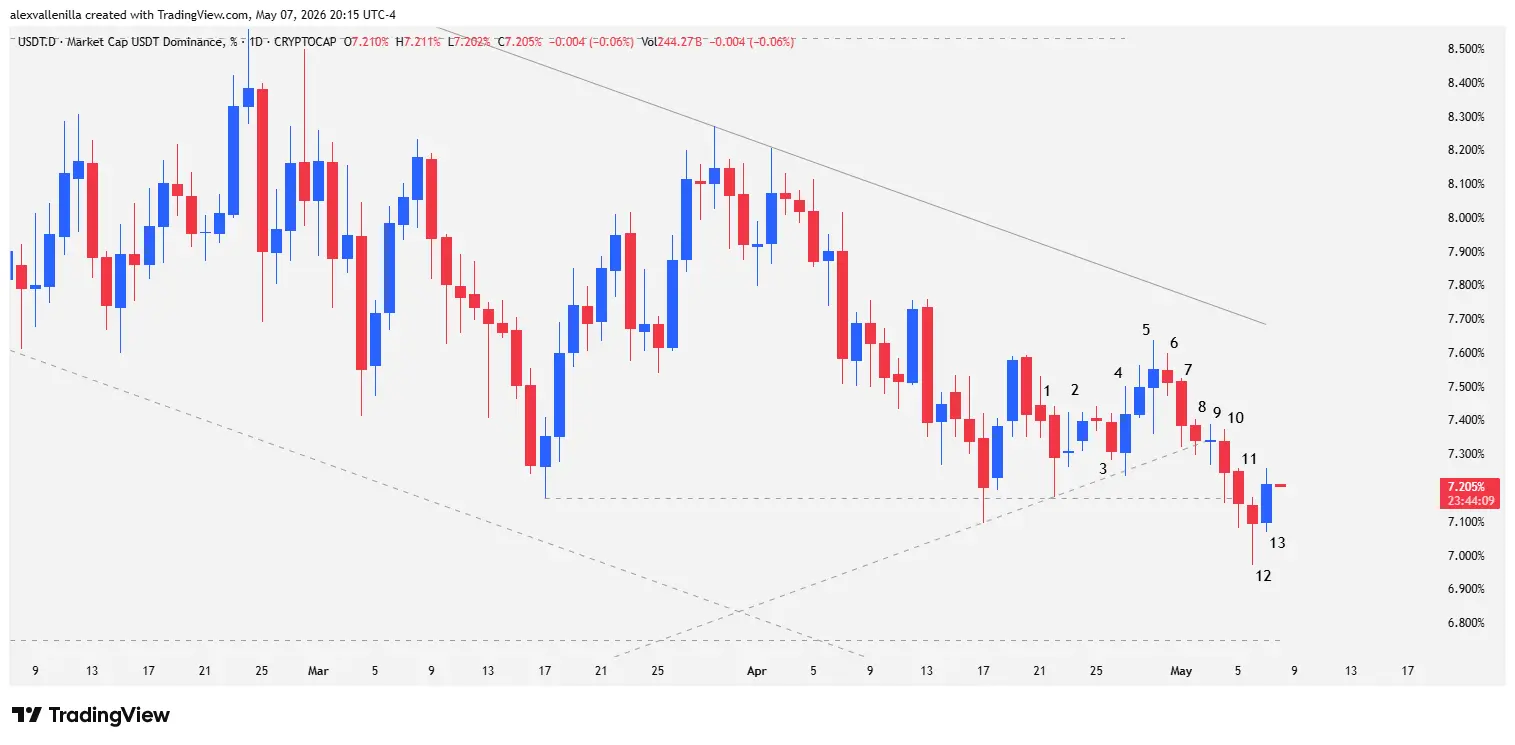
In a decisive shift for market structure, USDT Dominance (USDT.D) broke an ascending trendline that had remained intact for 209 bars. Following a series of battles at critical dynamic and horizontal support levels, selling pressure finally prevailed. This suggests that capital is flowing out of stablecoins and aggressively re-entering bitcoin and the alternative asset market.
The Tug-of-War Between Accumulation and Capitulation
The digital ecosystem is watching closely as the metric measuring the weight of the synthetic dollar against the rest of the market signals weakness. For investors, a drop in USDT dominance is a clear indicator of risk appetite. When traders abandon the safety of the dollar peg, they typically do so to seek yields in the spot market, an action that historically precedes massive bullish moves.
The current breakout was not an isolated event but the result of progressive exhaustion in a high-friction technical zone situated around 7.16%.
Technical Analysis: Anatomy of a Breakdown
The chart narrative breaks down into 13 key sequences dictating the shift in sentiment:
Bars 1 to 3: Bar 1 tested the 7.16% support within a long-term ascending channel. Although buyers appeared, Bar 2 (Doji) and Bar 3 (Small Bearish) confirmed that bullish momentum was drying up, congesting price action above the trendline.
Bars 4 and 5: A recovery attempt occurred with an outside bullish bar in Bar 4, but total overlap with the previous bar revealed a lack of conviction. Bar 5 (Outside Doji) marked a key Lower High within a 90-bar micro-bearish channel, indicating a definitive loss of momentum.
Bars 6 and 7: After a pause in Bar 6, Bar 7 executed the fourth test of the bullish trendline in just 14 candles, weakening the dynamic support.
Bars 8 and 9: Bar 8 set up a Low 2 sell signal. Bar 9, a wide-range Doji, finally triggered the sell signal and pierced the 209-bar trendline.
Bars 10 to 12: Confirmation arrived with Bar 10, which closed below the breakout. While Bar 11 showed some resistance, it managed to close below 7.16%. Bar 12 (Bearish Pin Bar) sealed the structure’s fate: the new 90-bar bearish channel now dominates the play.
Bar 13: Currently functions as a necessary technical pullback following the breakout, allowing the market to breathe before seeking new lows.
The Path Toward 6.74% Support
The invalidation of the primary bullish trend puts a clear target on the table: 6.74% support. If bears manage to pierce this level—a previous high that now acts as a wall—dominance could seek the channel floor at 6.27%. For the crypto investor, this scenario represents a green light for a potential prolonged rally.
Disclaimer: This analysis is for informational and educational purposes only. It does not constitute financial advice or investment recommendations. Trading crypto assets involves significant risk.
Communications Professional. Crypto Enthusiast. Economic Journalist. Bitcoiner & Altcoiner.