A violent bearish capitulation in the latest session halts the DEXE rally inside its ascending channel. Order flow exposes severe buyer exhaustion at a long-term structural resistance, forcing bulls to defend the final technical bastion at $13.53 to prevent a deep crypto crash.
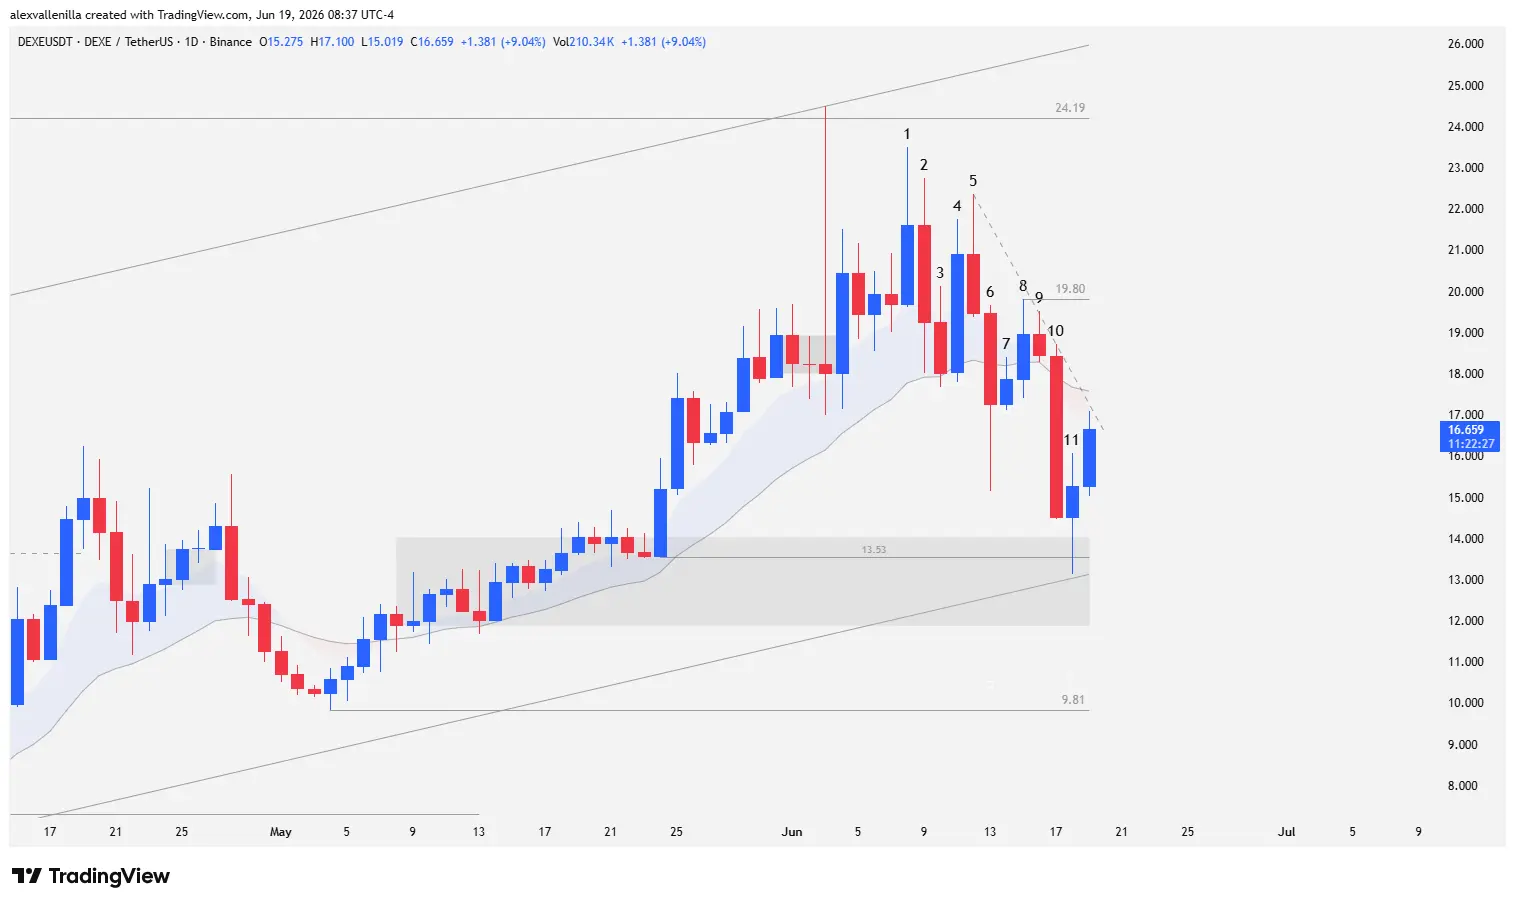
Bar 11 tests the base of the 119-period DEXE ascending channel, activating institutional demand in the key support zone at $13.53. / TradingView
The 500-Day Wall Triggers Profit-Taking
The DeFi ecosystem once again witnesses how market memory dictates the behavior of algorithms and retail traders. The crypto asset DEXE, locked in a solid bullish structure of 119 bars on its daily chart (1D), faces a critical market moment after running into macro resistance that had not been tested in over a year and a half.
The attempt to extend the momentum of an accelerated second bullish impulse ended abruptly. Institutional order flows reacted aggressively in the supply zone, triggering massive profit-taking that sent the price straight back to dynamic support levels. The complacency of late buyers (those who entered due to FOMO at the top of the channel) is being severely punished by a substantial spike in selling volatility.
Chart Anatomy: Bar-by-Bar Price Action Reading
The behavior of the last 11 daily sessions in DEXE offers a masterclass in how market psychology translates into candlesticks without the need for lagging indicators.
The Origin of the Collapse: Double Top and Bull Trap (Bars 1 to 3)
Bar 1: Bulls clearly lose momentum. Buy order flow fails to propel the price to test key resistance at $24.19 (the peak of the previous downtrend that had already generated a strong rejection days earlier). By printing a lower high compared to the previous attempt, Bar 1 confirms a structural double top against a wall undefeated for over 500 bars, immediately attracting short sellers.
Bar 2: Bears seize absolute control by injecting volatility. This candlestick prints a lower high and validates demand exhaustion on the second impulse of the 119-bar macro ascending channel, confirming that distribution has begun at the top.
Bar 3: Selling pressure momentarily pierces the 20-period Exponential Moving Average (20 EMA), though bulls manage to absorb part of the supply to close slightly above this dynamic level.
False Hopes and Price Compression (Bars 4 to 6)
Bar 4: A high-conviction bullish candlestick defends the institutional upward bias. The price closes above the 20 EMA after the previous correction, but the high remains below Bars 1 and 2. The upper wick or tail reveals that bears continue to absorb buying at higher levels.
Bar 5: Buyers attempt to follow through on the previous move by breaking above the high of Bar 4. However, latent supply thwarts the rally and forces a close right at the midpoint of the candlestick. The failure of the reversal becomes evident: “smart money” is not backing the upside.
Bar 6: Bears execute a decisive breakout below the 20 EMA, invalidating a secondary acceleration mini-channel. By breaking the low of Bar 4, the price action traps late buyers. Nonetheless, a prominent lower tail matching the size of the body shows that latent demand is absorbing the impact.
The Bearish Thrust and Support at $13.53 (Bars 7 to 11)
Bars 7 and 8: After a brief consolidation pause (Bar 7), Bar 8 manages a timid bounce back above the 20 EMA. However, it establishes local resistance at $19.80, capped by an upper wick that confirms the persistence of selling flow.
Bar 9: This candlestick prints as an inside bar (consolidation bar), confirming the overall reversal failure due to the inability to follow through on the previous day’s bounce.
Bar 10: Bears liquidate the market with a massive conviction capitulation candlestick. This is a shaved bottom bar (bearish Marubozu), proving that sell order flow dominated until the final second of the close. By violently breaking the 20 EMA, it opens a “liquidity void” by failing to directly test support at $13.53.
Bar 11: The last completed session prints as a highly uncertain Doji. Its lower wick pierces the key support at $13.53 and grazes the bottom of the macro ascending channel, triggering sell orders below the low of Bar 10, but managing a temporary bullish close that momentarily stops the bleeding.
Macro Scenarios: The Roadmap for Traders
Currently, the price experiences a technical bounce originating from Bar 11, seeking to recover from the base of the 119-bar channel. This zone confluues with a congestion area from the previous impulse and the last relevant high of the old bearish structure, making it a high-fidelity support level. However, the short-term bias remains bearish as lower highs continue to compress the price against the channel floor.
To completely invalidate the powerful sell signal from Bar 10 and resume the bullish trajectory, DEXE must reclaim the 20 EMA and break local resistance at $19.80. A successful breakout of that level would reactivate buy algorithms to launch a new assault on the macro resistance at $24.19.
Conversely, if supply cleanly breaks the floor of the ascending channel, it would confirm a macro structural shift, opening the door to a severe correction toward critical support at $9.81, a medium-term buyer control low.
The immediate future of DEXE is decided within a narrow liquidity band. The capitulation of Bar 10 keeps order flow under control, meaning the current bounce must be interpreted with caution. The larger structure remains intact, but bulls operate with zero margin for error at the base of their institutional channel.
Disclaimer: The information presented in this technical analysis does not constitute financial advice or investment recommendations. Trading crypto assets carries a high risk of capital loss.
Communications Professional. Crypto Enthusiast. Economic Journalist. Bitcoiner & Altcoiner.