A rigorous price action analysis on the DEXE daily (1D) chart reveals a major structural transition, where buyers absorb historical selling pressure. After breaking a prolonged 409-bar downtrend, the asset develops a spike-and-channel cycle within a 104-bar broadening bullish wedge. Order flow dynamics validate the presence of smart money, driving DEXE’s year-to-date performance to an impressive 530.30% in 2026, 128.34% on the annual timeframe, and a solid 92.88% over the past month.
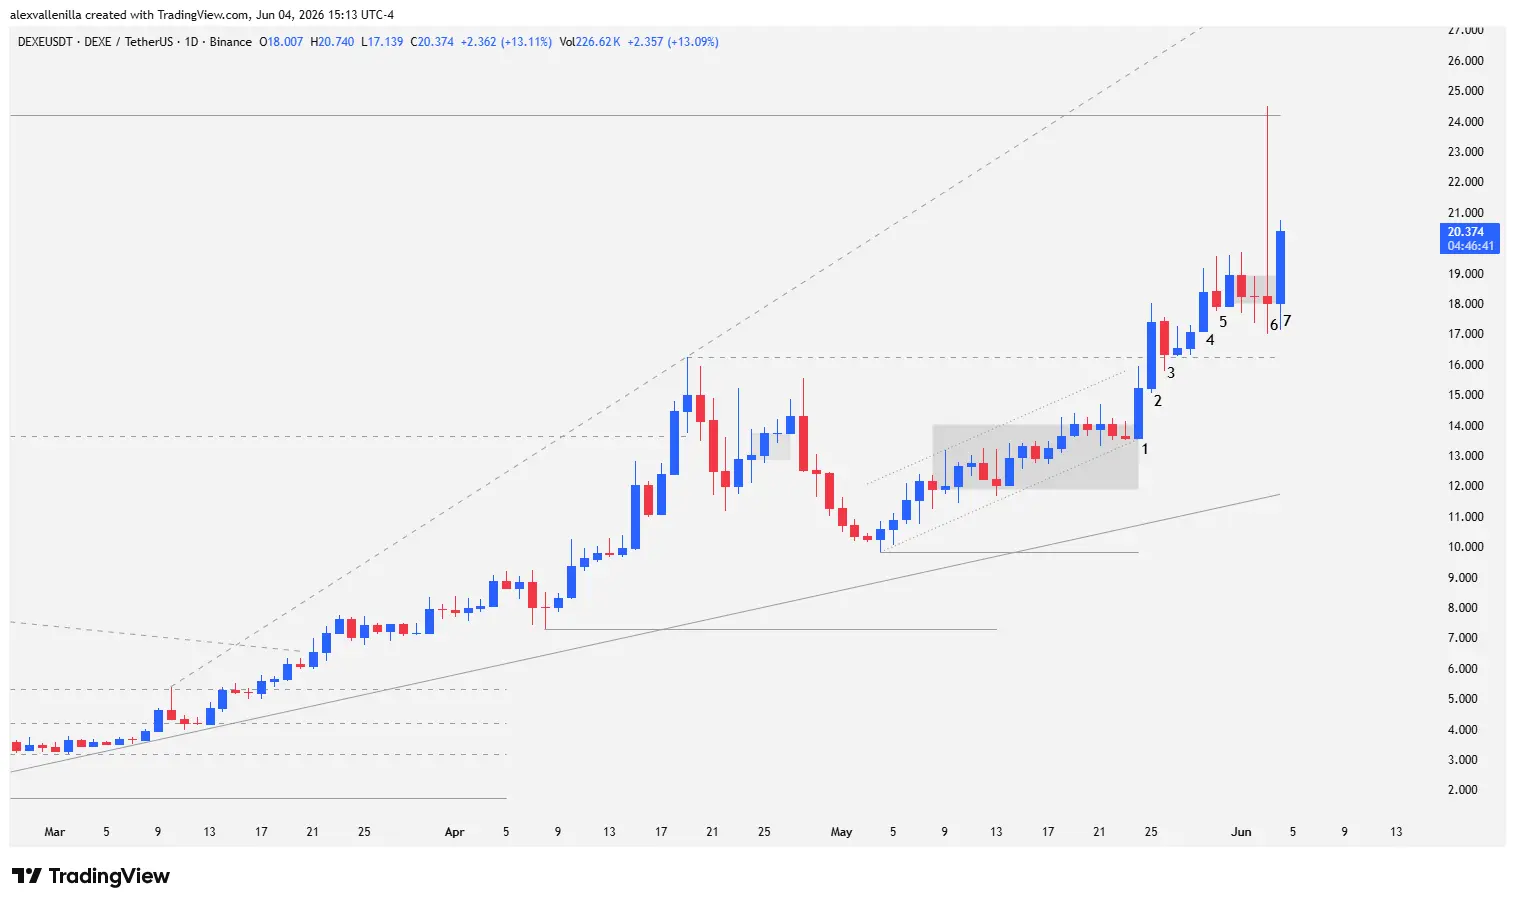
Chart Anatomy: Order Flow Under the Microscope
Recent price behavior breaks down into a sequence of seven key sessions that explain the collective psychology of market participants.
Bar 1: Congestion Breakout and Strong Hands Entry
The session opens without recording a lower tail, a direct reflection of buyers exerting immediate buying pressure from the first second. This wide-range, high-conviction bar breaches an overlapping congestion pattern, which contained a 20-bar tight channel in an accumulation phase. Although the session invites long positions, the high fails to test the critical resistance at $16.24 because sellers preemptively block the zone, which corresponds to the high of the ascending wedge’s first impulse.
Bar 2: Breakout Confirmation and High 2 Signal
Buyers extend total control of the daily range through a solid 14.40% advance. Even though the close fails to consolidate above $16.24, the midpoint of the candlestick body sits above this broken resistance. This move ratifies the previous range breakout, triggers buy stops placed above the Bar 1 high, and sets up a high-probability High 2 pattern, validating macro continuity.
Bar 3: The Failure of Bearish Pressure
Supply attempts to reintroduce price below the breakout level through a small bearish congestion candlestick. However, the bears only manage to pierce the zone temporarily and lack the necessary strength to close below it. The subsequent two sessions print inside and consolidation bars that respect $16.24, transforming the former resistance into a solid structural support and defining a bull flag with higher lows.
Bar 4: Range Expansion and Lagged Validation
This session executes bullish continuity by confirming the failure of the Bar 3 pullback. Absolute control by demand from the open propels price to a new relative high, surpassing the upper boundary of Bar 2 and formally, though belatedly, triggering the buy setup described above.
Bar 5: Profit Taking and Absorption Pinbar
Selling activity reappears as a bearish-closing Pinbar candlestick, exhibiting an upper tail twice the size of the real body. Bulls attempt to extend the rally but run into a dense block of liquidation orders and profit-taking. However, the session immediately following invalidates this bearish attempt with an overlapping performance that generates a failed pullback, returning price to a dormant congestion phase.
Technical Analysis: Extreme Volatility and Measured Move Projections
Bar 6: Testing the Last Bearish Bastion
This session injects extreme volatility into the market. Buyers unleash a parabolic impulse that reaches structural resistance at $24.19, a level representing the peak of the former 409-bar downtrend. Price rapidly recovers almost all previous losses in just 104 sessions.
Despite the feat, the chart exposes a massive intraday rejection: a massive influx of sellers and the execution of profit-taking orders sink the price, preventing a close above resistance. The candlestick closes within the range of the previous session and prints a lower high, confirming the congestion and issuing a reversal warning signal, which demands immediate neutralization.
Bar 7: Institutional Injection and Second Leg Projection
At the time of writing, Bar 7 is fully developing and exhibits outstanding bullish quality. Demand completely absorbs the supply of the previous session through a solid body spanning almost the entire range, revealing clear participation from institutional capital. The session breaks upward out of the congestion established between Bars 5 and 6.
If the current session consolidates this breakout, the market will officially initiate a second bullish leg. By calculating a measured move equivalent to the distance of the first leg (starting at Bar 1), technical analysis projects a primary target at the $24.19 resistance for a definitive retest.
Outlook
DEXE successfully completes a two-leg macro bullish structure, a classic behavior in breakout cycles following prolonged downtrend capitulations. Overcoming the Bar 6 high will completely invalidate the previous session’s reversal signals. In that continuation scenario, supply will pull back from the intermediate zone, opening the doors to the next technical expansion target at $27.23. Conversely, any signs of exhaustion or rejection at current levels will force traders to monitor the key support zone at $16.24.
Disclaimer: This analysis is provided for informational, educational, and journalistic purposes only, and does not, under any circumstances, constitute investment advice, financial recommendation, or a solicitation to trade digital assets.
Communications Professional. Crypto Enthusiast. Economic Journalist. Bitcoiner & Altcoiner.