The digital asset market is breathing tension. PAX Gold (PAXG), the physical gold-backed token that institutional and millennial investors often turn to as a safe haven, is currently trading at $4,561, posting a partial loss of 1.92% in today’s session. After repeatedly failing to break its key resistance at $5,027, price action is compressing into a complex technical structure that threatens to trigger a massive sell program if bulls lose control of macro support.
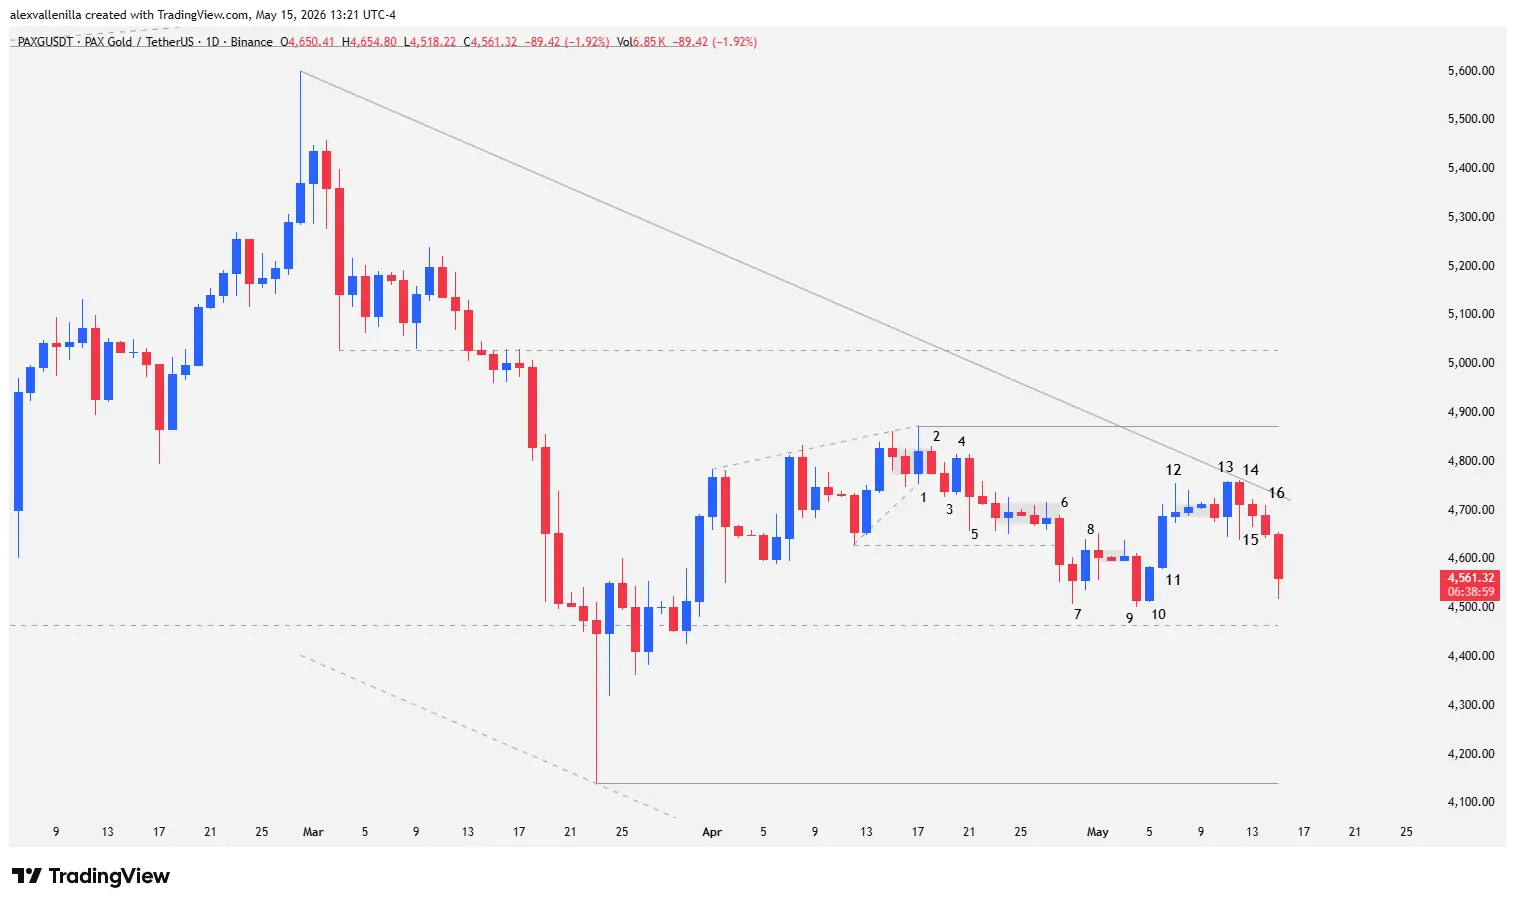
Chart Anatomy: The Tug-of-War Between Bulls and Bears on the Daily (1D) Chart
PAXG price action over recent sessions paints a classic distribution and loss of bullish momentum scenario, where every recovery attempt runs into a wall of supply.
Initial Weakness and Fakeouts
The current move stems from Bar 1, a small-bodied bullish pattern that showed a slowdown in higher highs and compressed price into an ascending wedge, unable to reach the $5,027 resistance. Bar 2 consolidated this weakness as a bearish inside bar that halted the advance.
Although Bar 3 broke the ascending wedge to send an early sell signal, bears lacked immediate follow-through. This allowed Bar 4 to emerge—a moderate bullish attempt whose high stayed below Bar 1, confirming buyers’ inability to sustain higher prices.
Loss of Intermediate Support and the Double Bottom
Volatility returned with Bar 5, a bearish move that trapped buyers from the previous session by closing below its low, though it temporarily respected support at $4,629. However, selling pressure broke this level on Bar 6, invalidating the prior bounce.
Price then sought a critical demand zone at $4,460:
Bar 7 (a bearish-closing pinbar) tested this level, but the lower tail revealed institutional money stepping in to defend the zone.
Following a brief reversal on Bar 8 and subsequent congestion, bears attacked again on Bar 9 with a strong conviction body.
Failing to pierce $4,460, Bar 9 and Bar 7 set up a Double Bottom pattern.
The defense of this strategic support materialized in Bar 10 (a bullish inside bar) and exploded in Bar 11, a large-bodied, high-conviction impulse that brought hope back to the market.
Expanded Technical Analysis: The 77-Bar Trendline Arbitrates the Trend
Despite the optimism injected by Bar 11, the bearish macro context imposed its law of gravity over the following sessions.
Bar 12 thwarted the advance by printing a pinbar with a massive upper tail, an unmistakable sign that sellers were defending the upper range. After another congestion phase, Bar 13 appeared as a high-volatility bullish outside bar; it absorbed supply via a lower tail, but its inability to test the high of Bar 2 highlighted buyer exhaustion.
The definitive turning point came with Bar 14. This outside-range, bearish-closing pinbar served to technically adjust the primary descending trendline that has dragged price down for 77 bars. Failing to clear the $5,027 resistance, the market established an intermediate ceiling at $4,870 (Bar 2 high).
Bar 15 (a small-bodied inside bar) attempted to temporarily stabilize price, but Bar 16 confirmed the absolute rejection of the 77-bar trendline by breaking the previous low.
Market Outlook and Future Scenarios
If the current bar closes at or below current levels, the PAXG daily chart will trigger a Low 2 sell setup, establishing a bearish trigger just below its low.
Bearish Scenario (Higher Probability)
To consolidate the macro trend continuation, bears must pierce the critical $4,460 support on high volume. A sustained close below this zone would open the door to $4,100, a level representing the final low printed during the drop over the last 77 bars. If pressure persists, the token could seek the lower boundary of its newly developing ascending channel, whose dynamic support sits at $3,500.
Bullish Scenario (Demand Validation)
Conversely, if buyers manage to absorb the current sell flow and defend $4,460, PAXG will trigger a bounce that faces its first major test at the dynamic trendline resistance, located at $4,720. Only clearing this level and the secondary resistance at $4,870 would invalidate the short-term bearish bias.
PAXG’s technical behavior proves that not even assets backed by physical gold are exempt from the discipline of long-term trendlines. Losing $4,460 will not only invalidate the double bottom pattern, but it could re-establish the token’s structure for months to come, turning what looked like a recovery channel into a painful bull trap.
Disclaimer: The information presented in this article is for educational and informational purposes only and does not constitute, under any circumstances, investment advice, financial counsel, or an invitation to trade digital assets. Cryptoassets exhibit high volatility; only risk capital you are willing to lose.
Communications Professional. Crypto Enthusiast. Economic Journalist. Bitcoiner & Altcoiner.