The cryptocurrency market shows no mercy, and OKX’s native token, OKB, has become the stage for an intense technical dispute. After posting a positive year-to-date return of 59.99%, but hit by a 7.85% contraction over the last quarter, the asset fights to define its direction. Institutional traders and the retail community are closely watching a daily chart dominated by a 303-bar macro bearish structure, where pure price action and order flow dictate the rules of the game, leaving lagging traditional indicators aside.
The Failed Rally and the Bull Trap
OKB’s recent narrative exposes how smart money absorbs retail liquidity. Following a prolonged period of sideways price action, buyers attempted to take control of the market, triggering a high-volatility sequence that reconfigured the local support and resistance map.
Bar-by-Bar Technical Analysis: The Collapse and Institutional Response
The Bull Trap and Bear Counterattack (Bars 1 to 5)
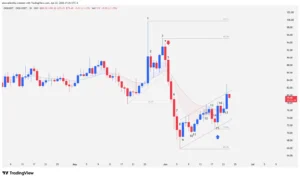
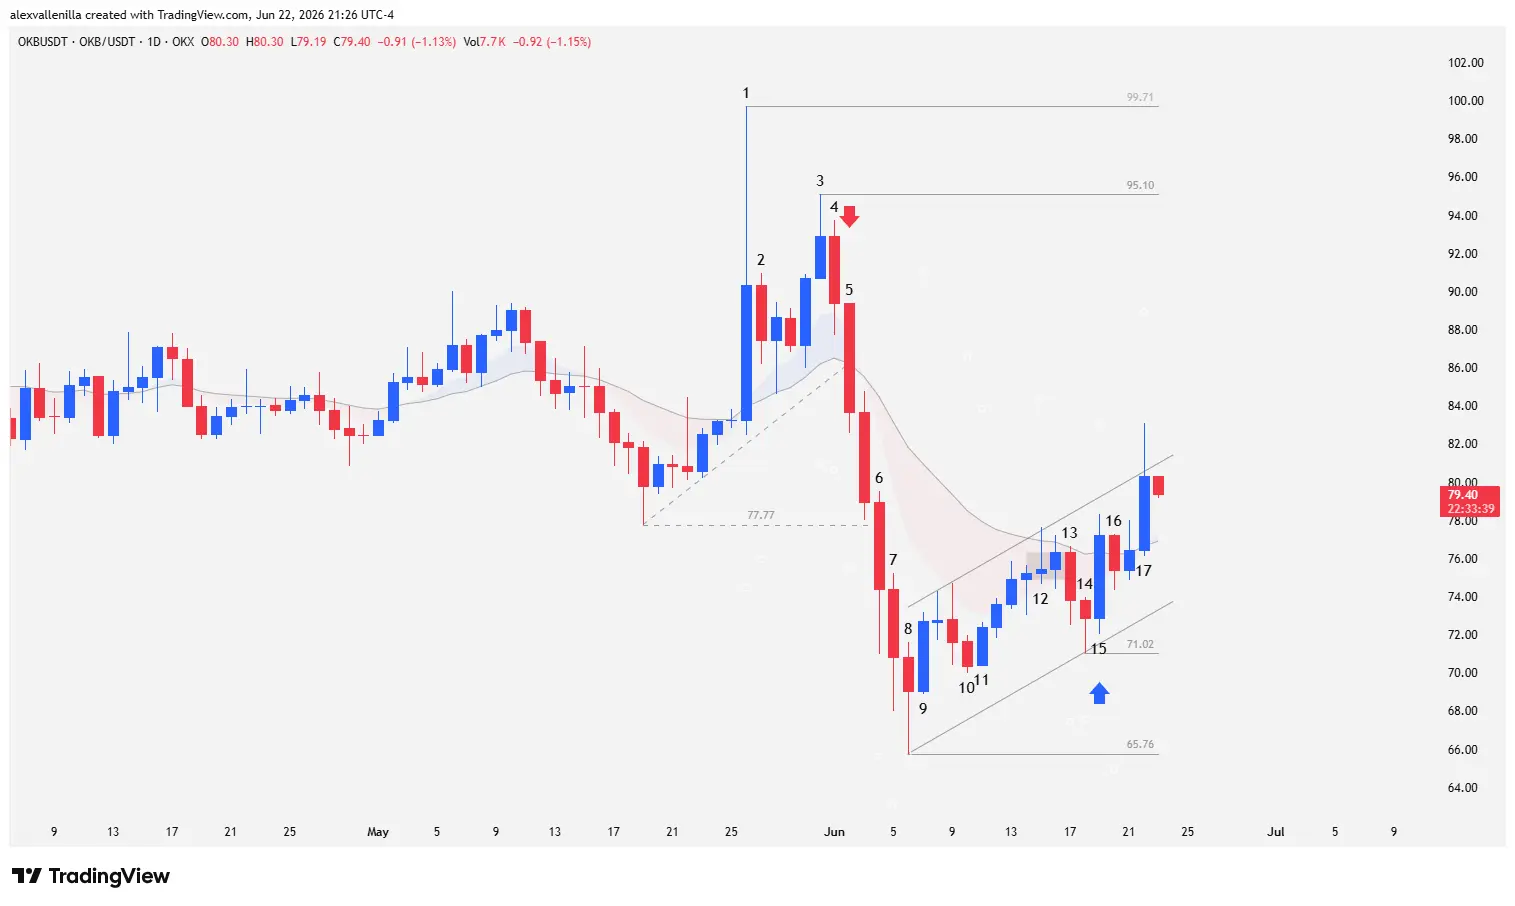
Bar 1: Bulls attempt an upside breakout with a wide-range bar. However, the effort falls short; a prominent upper tail that exceeds the body size proves that sellers massively absorbed buy orders. The high establishes fixed resistance at $99.71, printing a lower high against the previous peak of $124.22.
Bar 2: Price enters a brief defensive consolidation, managing to keep its low above the 20-period exponential moving average (20 EMA).
Bar 3: Buying pressure attempts to follow through on the move. However, the appearance of another upper wick the size of the body confirms that supply successfully defends $99.71. Floating entirely above the 20 EMA within a macro bearish structure, this session becomes an EMA gap bar, trapping buyers. Bears execute the classic “sell the rally” strategy.
Bar 4: The downside reversal triggers. The lower high prints below the previous session, while the body completely engulfs Bar 3 and closes below its low, confirming an absolute loss of bullish momentum.
Bar 5: Strong hands take absolute control via a high-conviction bearish candle. Price breaks down below a 14-bar microchannel and pierces the 20 EMA. By closing below this moving average, it triggers a high-probability Low 2 short setup, sparking widespread panic known in Price Action jargon as “bears on the run.” The following session invalidates the previous low and formally triggers the sell orders.
Deceleration and Bear Capitulation (Bars 6 to 10)
Bar 6: Selling inertia obliterates local support at $77.77 (the low of the previous microchannel). Despite the drop, the development of a generous lower tail reveals that institutional demand is starting to reappear.
Bar 7: Bears slightly pierce the previous low, but the body shrinks and the lower wick persists, starting a clear deceleration pattern.
Bar 8: A pinbar with a bearish close seals the loss of supply strength. The lower wick vastly exceeds the body, and the close respects the low of Bar 7, establishing critical support at $65.76. This level proves key as it avoids testing the absolute low of the macro bearish structure at $60. The tails of bars 6, 7, and 8 form a buying pressure block.
Bar 9: Buyers step in aggressively, breaking above the high of the previous pinbar and completing an order flow reversal.
Bar 10: Sellers attempt to resume the trend but print an extremely weak two-bar pullback consisting of small candles that ends in a higher low, attracting more buying.
The Low 2 Failure and Bear Capitulation (Bars 11 to 17)
Bar 11: Bulls absorb the selling from Bar 10. A modest upward push begins, experiencing deceleration and finding dynamic resistance at the 20 EMA.
Bar 12: A new pinbar collides with the 20 EMA. Although it pierces it during the session, bears defend the dynamic moving average, preventing a close above it and plunging price into a tight trading range.
Bar 13: Bears try to resume the broader decline by breaking below the base of the consolidation range.
Bar 14: Supply fails to follow through or close below the low of Bar 13. The low of this session establishes local support at $71.02, drawing a new counter-trend microchannel. Although a Low 2 short setup technically forms, the market fails to generate the bearish bar required to trigger the sell orders.
Bar 15: A violent market reversal occurs. Strong hands inject capital through an imposing, high-conviction bullish bar that closes firmly above the 20 EMA. The move breaks above the high of Bar 13 and invalidates the Low 2 pattern from Bar 14. This technical failure traps late sellers, forcing them to cover their short positions and catapulting the price upward.
Bar 16: The market takes a breather with an inside consolidation bar that processes the previous gains.
Bar 17: Buyers validate the strength of Bar 15 by breaking its high and closing above the 20 EMA. Despite the bullish success, a notable upper tail warns that supply remains active near resistance.
Macro Perspective: Where OKB Is Headed
Current price action shows OKB compressing within a wide trading range bounded by support at $65.76 and resistance at $99.71. Although the main 303-bar structure remains bearish, bears show signs of exhaustion as they fail to push price toward medium-term support at $60.
The 15-bar bullish microchannel built after the Low 2 failure suggests the market wants to break the primary downward trendline. If buyers maintain control above the 20 EMA, price will look to test the fixed resistance at $95.10 in the coming days. In the alternative scenario, if the current structure fails and the microchannel breaks, the $71.02 level (Bar 14 low) will act as the first defensive bastion before an eventual retest of the $65.76 support.
Disclaimer: The analysis presented in this article is for educational and informational purposes only and does not constitute, under any circumstances, investment advice or a financial recommendation. Cryptocurrency trading involves a high risk of capital loss.
Communications Professional. Crypto Enthusiast. Economic Journalist. Bitcoiner & Altcoiner.