During the final trading sessions of 2026, the bitcoin (BTC) market transformed the psychological $60,000 zone into a true battleground. After accumulating a 29.10% year-to-date correction, daily price action reveals an intense struggle for order flow. Despite the activation of a chart pattern with bearish implications, sellers are showing signs of exhaustion. This has allowed buyers to execute a liquidity sweep at the bottom of the range and test the 20-period exponential moving average (20 EMA).
The Macro Context: 270 Sessions Under Supply Dominance
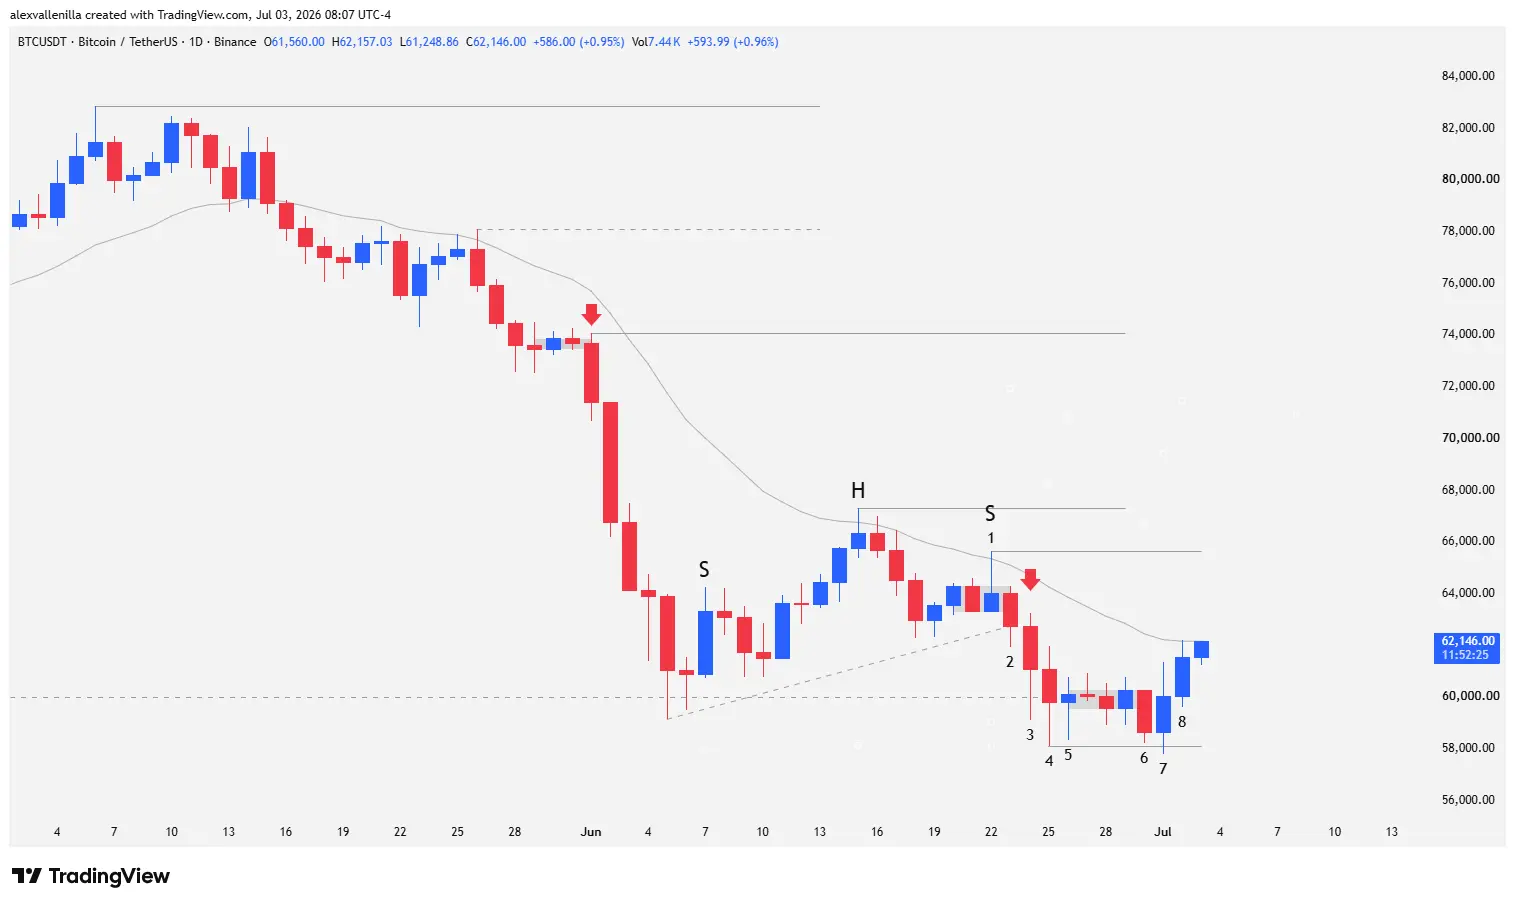
Bitcoin’s structural backdrop demands caution. The king asset has maintained a primary bearish structure for 270 sessions, accelerating after a bull trap at the $82,850 macro resistance. This institutional rejection triggered a severe correction, dragging down a 42.91% loss over the last 12 months and 7.19% in the recent quarter. As a result, the price returned to its operational base, seeking liquidity at previous support levels.
Candlestick Chronicle: Anatomy of Order Absorption
Exclusive price action technical analysis, free of lagging indicators, allows us to break down auction psychology through the numerical sequence of its daily bars:
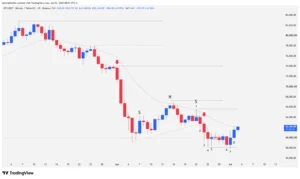
Bars 1 to 3: Head-and-Shoulders Activation and the Low 2 Trap
Bar 1: Bulls attempt to pierce the 20 EMA, but supply responds aggressively, creating a pin bar with a pronounced upper tail. This price action completes the right shoulder of a Head-and-Shoulders (H&S) pattern, establishing critical structural resistance at $65,622.
Bar 2: The bearish order block takes control and successfully breaks a previous congestion pattern.
Bar 3: Volatility expands. Sellers confirm the breakout of the H&S neckline. However, the order flow shifts at the bottom: the candle generates a massive lower tail equal to its body size. Although the low pierces $60,000, the inability to close below this level reveals massive supply absorption in an accumulation zone. Technically, Bar 3 sets up as a high-probability Low 2 sell trigger under the 20 EMA, threatening bearish continuity.
Bars 4 to 6: Supply Exhaustion and Congestion
Bar 4: Bears activate the sell orders from Bar 3 by breaking below its low, marking new structural support at $58,115. However, the heavy overlap with the previous bar and a close above the Bar 3 low demonstrate that selling momentum lacks follow-through.
Bar 5: An inside bar pin bar appears. By failing to test the previous low, it halts the price drop and drags the market into sideways congestion for the next four sessions.
Bar 6: This bar attempts a bearish breakout from the congestion, but its inability to test $58,115 confirms the sellers’ weakness.
Bars 7 and 8: The Market Pivot and Structural Failure
Bar 7: Volatility returns via an outside bar. Bears attempt to breach support once more, but buyers absorb all sell orders, triggering a short squeeze. Sitting at the base of a two-legged downward move, this bar becomes a powerful reversal signal.
Bar 8: This bar confirms the strength of the bullish counterattack. The price rises decisively, and the high of the bar directly tests the 20 EMA.
Projection Scenarios: Invalidation or Macro Capitulation
The current bounce is playing out strictly counter-trend, which sets up two very clear technical scenarios for the coming sessions:
Bullish Scenario (H&S Failure): If demand manages to pierce the 20 EMA with body and volume, the price will target the key resistance at $65,622 (the Bar 1 high). Reclaiming this level would invalidate the Bar 3 sell signal. Failures of mature H&S structures typically trigger explosive moves in the opposite direction due to the capitulation of trapped short positions.
Bearish Scenario (Trend Continuation): If the 20 EMA or the $65,622 resistance rejects the price, bears will look to break the structural support at $58,115. Losing this zone would open the doors for bitcoin toward the macro support at $52,550—an institutional liquidity level the price has not visited in the last 666 sessions.
The bears’ inability to sustain closes below $60,000, combined with the reversal outside bar at the $58,115 support zone, suggests that the market executed a liquidity sweep before attempting a change of character in the order flow.
Disclaimer: The price action analysis presented in this article is for purely educational and informational purposes and does not constitute financial advice or an invitation to invest. Crypto assets are highly volatile; conduct your own research before risking capital.
Communications Professional. Crypto Enthusiast. Economic Journalist. Bitcoiner & Altcoiner.