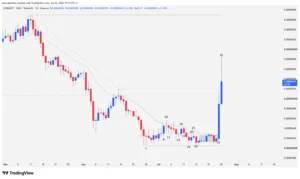
The altcoin market is catching a second wind following ZBCN’s recent performance. After a grueling 148-bar cycle dominated by sellers, the asset achieved what many analysts expected: a definitive breakout from its primary downtrend. Through a “V-shaped” recovery structure and strategic compression against key resistances, ZBCN validated a sentiment shift that puts the $0.061 target back on investors’ radars.
Anatomy of a Recovery: From Support to Explosion
ZBCN’s resilience began taking shape at the $0.0015 levels, where a precise bounce established the foundation for a narrative shift. The market transitioned from a freefall to an orderly congestion pattern, where every recorded low was higher than the previous one ($0.0018), signaling that supply absorption was underway. This accumulation period was the necessary prelude to the volatility spike that today positions the asset above critical technical barriers.
Technical Analysis: Bar Narrative and Price Action
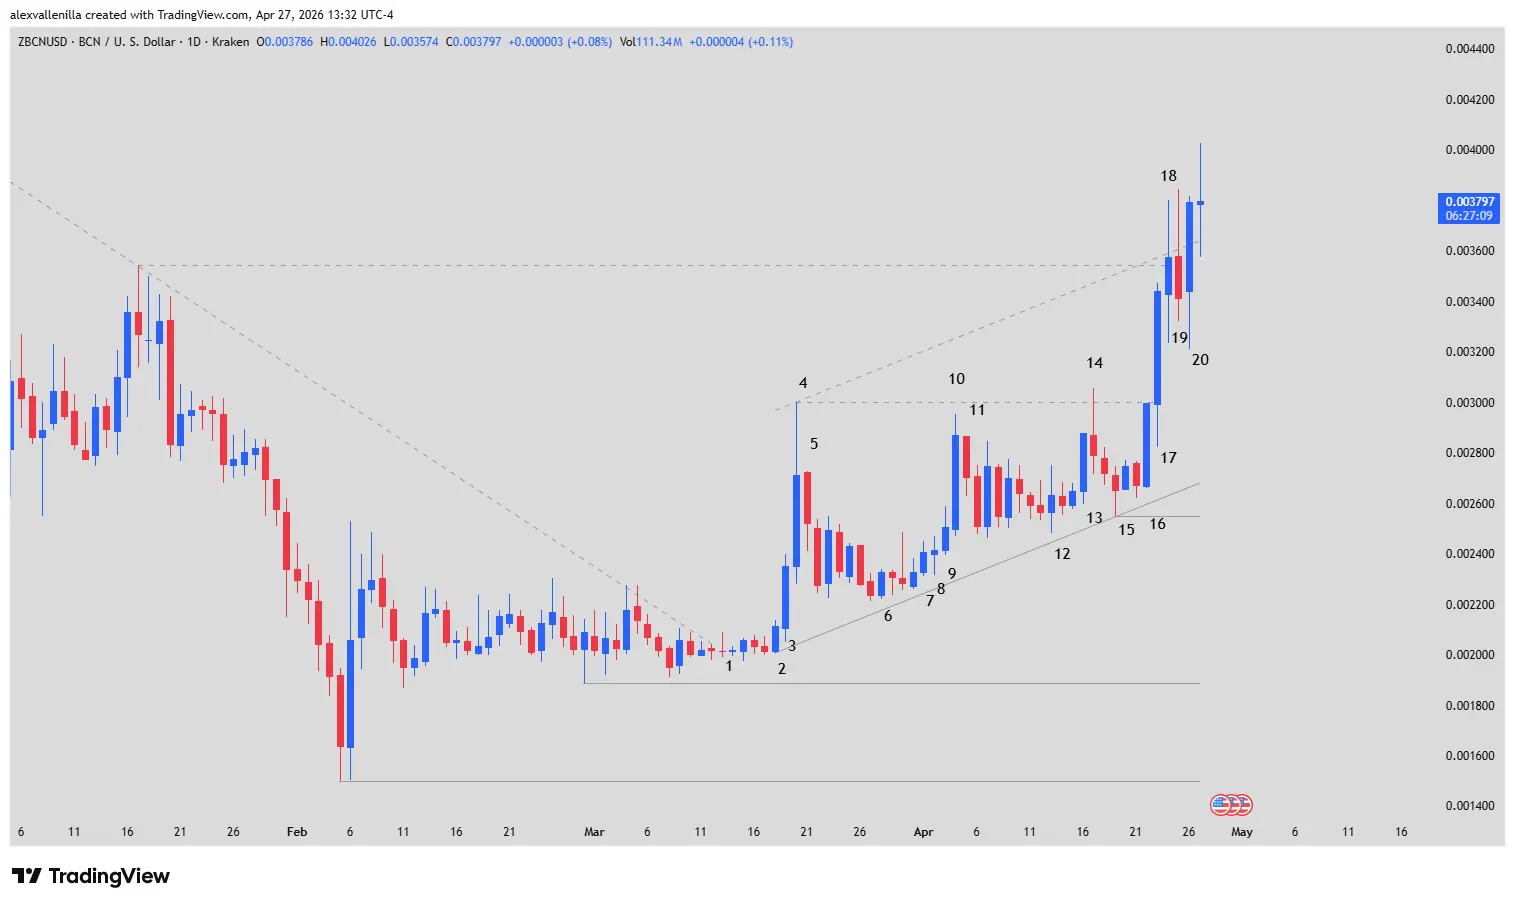
The ZBCN daily chart reveals a tactical battle won by the bulls. Below, we break down the movement based on the technical bar sequence:
Phase 1: Breakout and First Impulse (Bars 1 to 4)
Bar 1 marked a historic milestone: the end of the 148-bar downtrend, maintaining support at $0.0018. Bar 2 executed the breakout from the congestion pattern, but Bar 3 confirmed the strength of the move. The latter was not only a solid bar (shaved, with no tails) boasting an 11.21% gain, but it also functioned as a High 2 buy setup. Bar 4 extended the rally to $0.0030, though a 30% upper tail revealed that sellers were still attempting to defend the legacy structure.
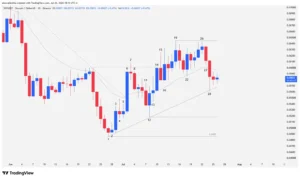
Phase 2: Consolidation and Accumulation (Bars 5 to 15)
Following the initial peak, price entered a “digestion” period. Bar 5 (an inside bar) and subsequent overlapping sessions showed a necessary pause. Bar 8 stands out—a Doji that, despite its morphological indecision, served as a second buy signal (High 2) by maintaining higher lows. Momentum resumed with Bar 10, a high-conviction candle with no lower tail.
The market faced a challenge at Bar 14, a rejection Pin Bar in the $0.0030 zone. However, this failure to clear resistance did not lead to a collapse; on the contrary, Bar 15 confirmed that the dynamic support (40-bar trendline) remained intact, compressing price against resistance in a technical “pressure cooker.”
Phase 3: Structure Shift and Overshooting (Bars 16 to 20)
Bar 16 was the final warning: a shaved candle (marubozu) that tested $0.0030. Finally, Bar 17 unleashed the accumulated power with a 14.74% jump, closing above resistance. Bar 18 took the drama to the extreme, surging past $0.0035 (the relevant high of the major downtrend) and generating an overshooting effect above the bullish channel.
Finally, Bar 20 consolidated the bullish victory with a 12.16% advance, ignoring liquidation attempts and establishing a new operational floor above the breakout zone.
Toward the All-Time High?
ZBCN has completed the transition from a depressed asset to one in an active uptrend. Surpassing $0.0035 is not just a price move; it is a technical structure shift. If the asset manages to hold the dynamic support at $0.0026, the path toward the $0.061 all-time high remains clear, potentially under a parabolic acceleration model.
Disclaimer: This analysis is for informational and educational purposes only. It does not constitute financial advice. Cryptocurrency investments carry high risk due to market volatility.
Communications Professional. Crypto Enthusiast. Economic Journalist. Bitcoiner & Altcoiner.