Amid expanding global liquidity and Middle East tensions forcing an asset rotation, Bitcoin (BTC) achieved a crucial technical milestone: breaking a bearish structure that dominated the market for 26 weeks. With a net capital inflow of $709.7 million through ETFs in the past week, the benchmark crypto asset is positioning itself as the preferred safe haven against a gold sell-off in Arab nations, confirming that the “digital gold” narrative is more alive than ever.
The Macro Context: Liquidity and Capital Rotation
Bitcoin’s current resilience is no coincidence. According to Checkonchain data, ETF instruments recorded their fourth consecutive week of positive flows. Added to this is an unusual geopolitical phenomenon: the crisis in the Strait of Hormuz forced Arab nations to liquidate gold reserves for immediate liquidity due to oil export difficulties. This selling pressure on the precious metal caused investors to rotate capital into BTC, whose liquidity and ease of transfer make it ideal in times of uncertainty.
Technical Analysis: Breaking Down the 1W Chart Breakout
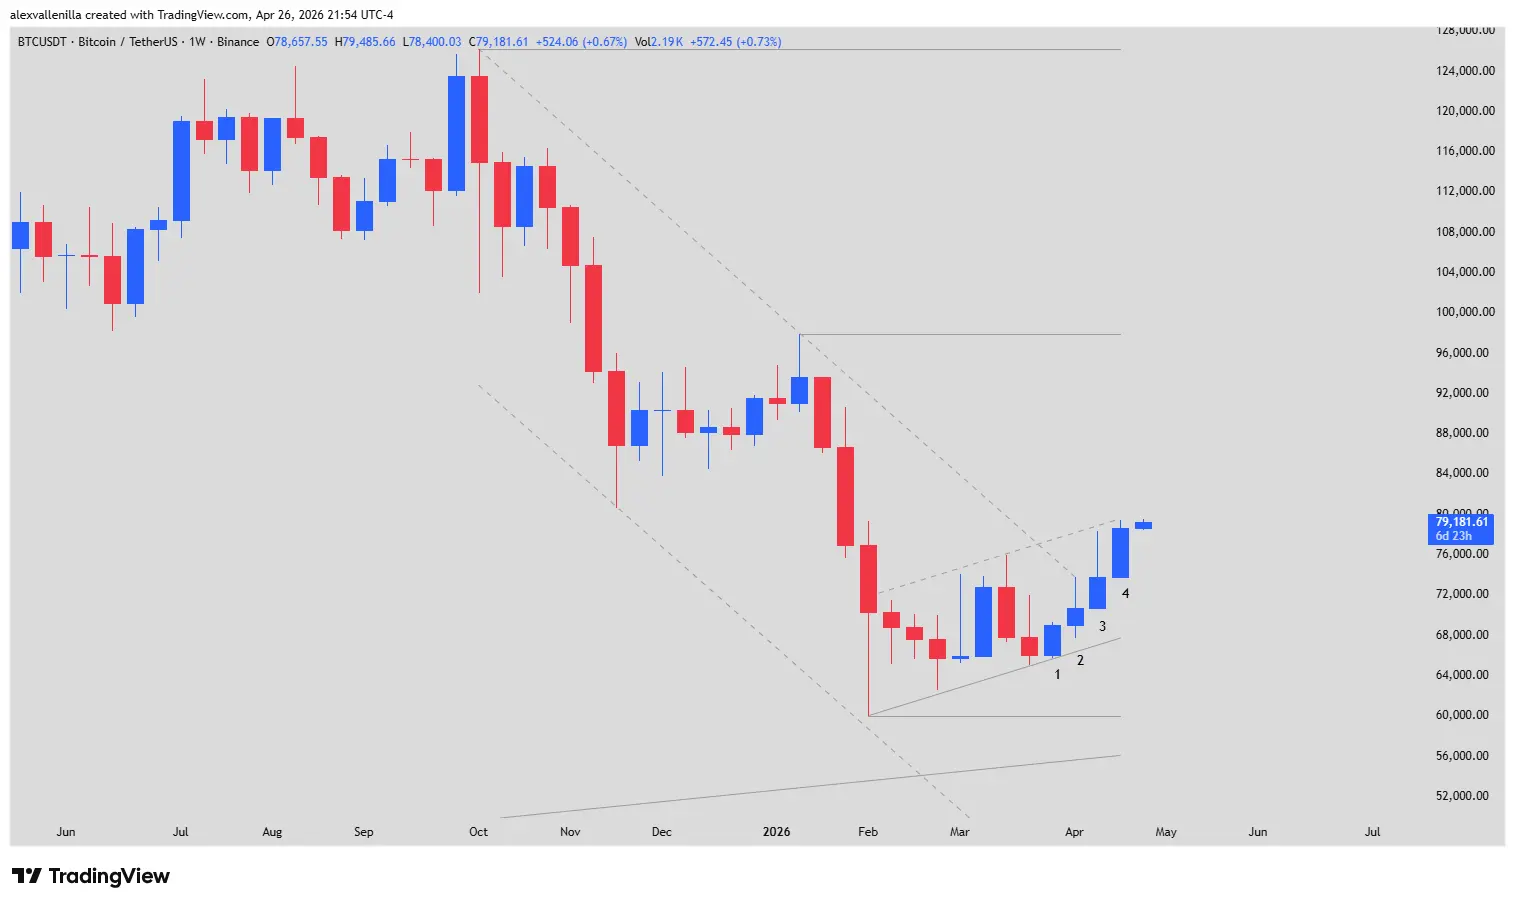
To understand the health of this move, we must closely observe price action over the last four weeks (Bars 1 to 4) on the weekly (1W) chart.
The Battle of the Bars: From Pullback to Confirmation
Bar 1 (Strategic Consolidation): This bullish inside bar functioned as a “reversal failure.” Bears attempted to push the price lower but failed, establishing a higher low that gave rise to an 11-bar counter-trend bullish microchannel.
Bar 2 (Active Resistance): A pinbar with a prominent upper wick. Here, price tested the 26-week bearish trendline. Although bears liquidated positions at this level, bulls showed strength by maintaining higher highs and higher lows.
Bar 3 (The Breaking Point): Despite volatility and selling pressure in the $60,000 zone, this bar achieved the unthinkable: closing above the main bearish trendline. Its lack of a lower wick reveals absolute buying conviction from the start of the week.
Bar 4 (Breakout Confirmation): This is the follow-through bar. By closing above the high of Bar 3 and testing the upper side of the microchannel, it confirms that the bearish structure initiated from the $126,200 high is officially invalidated.
Market Structure and Key Levels
Although the 26-week trend was broken, the market still moves within a 172-bar macro bullish trend. However, to declare a total victory for the bulls, price must face two critical zones:
Dynamic Support ($67,700): Located at the lower side of the current microchannel. Any healthy pullback should find demand at this level.
Validation Resistance ($97,900): This is the most relevant high of the previous bearish structure. Only by overcoming and consolidating above $97,900 will Bitcoin clear all doubts and enter a price discovery phase or a high-volatility range.
A New Playing Field
The trendline breakout does not guarantee a vertical ascent, but it does change the rules of the game. With increasing liquidity in the U.S. and solid fundamental support, Bitcoin has stopped playing defense and started leading. The market now watches closely to see if volume will accompany this move to transform a technical breakout into a parabolic bull market.
Disclaimer: This article is for informational and educational purposes only. It does not constitute financial advice. Crypto asset investments carry high risk. Conduct your own research before making investment decisions.
Communications Professional. Crypto Enthusiast. Economic Journalist. Bitcoiner & Altcoiner.