The crypto ecosystem wakes up with a new protagonist on investor radars. Stable (STABLE) managed to decouple from general market apathy, posting an impressive 57.46% rally over the last 24 hours. After weeks of sideways price action and congestion on the daily (1D) charts, an explosion in volume and bullish conviction led the asset to challenge key resistance levels, bringing its year-to-date performance to a staggering 202.25%.
The Awakening of a Sleeping Giant: Accumulation and Breakout
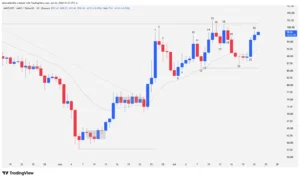
Stable’s behavior over the last month, with cumulative gains of 58.20%, is no coincidence. Technically, the asset underwent a “digestion” process following a previous two-legged bull move. This period of pause, characterized by a defined trading range, served as an accumulation zone where supply was absorbed by strong hands.
The resilience of support levels and the formation of higher lows suggest the market was priming the ground for the current move. While other altcoins show weakness, Stable positions itself as the top-performing asset of the day, attracting the attention of traders seeking volatility and solid technical structures.
Technical Analysis: Breaking Down the STABLE 1D Structure
To understand where price is heading, it is essential to analyze the narrative that Japanese candlesticks have built in recent sessions.
Retracement and Congestion Phase (Bars 1 to 2)
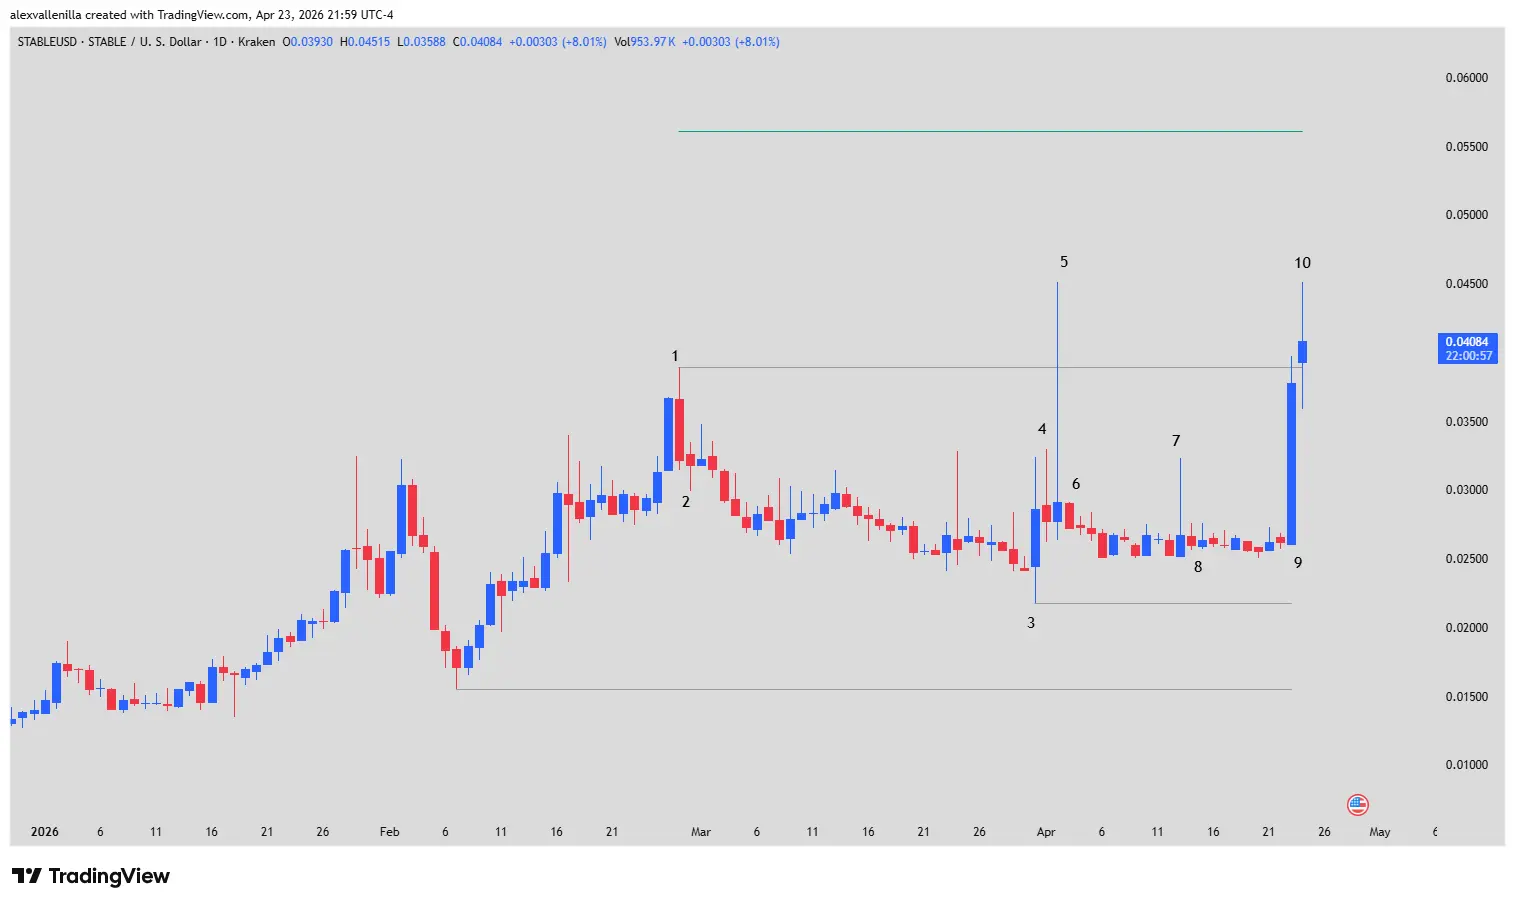
Bar 1 marked the exhaustion of the previous bullish move with a 12.24% retracement. Despite the drop, it left a 30% upper tail, establishing critical resistance at $0.0387. Starting from Bar 2, price entered a “barbed wire” (congestion) phase, where a lack of bearish conviction translated into small bodies and multiple tails, indicating that sellers lacked the strength to collapse the asset.
The Battle for Support (Bars 3 to 5)
Bar 3 was the first warning from the bulls. With high volatility, it established solid support at $0.02176. This level is vital: it is a “higher low” compared to the previous bounce at $0.0155, keeping the long-term bullish structure intact. Although Bar 4 and Bar 5 (a high-volatility pinbar) attempted to break the resistance of Bar 1, the market decided to continue consolidating within the range.
The Surge: Conviction Breakout (Bars 9 and 10)
After a renewed lull in Bars 6, 7, and 8, where sellers again failed to pressure the price, Bar 9 appeared. This move is, technically, a masterful “trend bar”:
Gain: +44.09%.
Morphology: No lower tail, demonstrating that buyers dominated from the open.
Impact: It broke the accumulation zone with the greatest strength seen in the entire series.
Currently, Bar 10 is trading at $0.0417 (up 10.29% at the time of this report). This is a doji whose open is already situated above the old resistance of Bar 1, signaling that what was once a ceiling is now attempting to act as a floor.
Market Projection: Where Are We Heading?
If Stable manages to consolidate a daily close above $0.0389, the technical scenario projects a “measured move.” By taking the height of the range (the distance between the high of Bar 1 and the support of Bar 3) and projecting it from the breakout point, we obtain a technical target at $0.0561.
This level would represent a logical continuation of the macro trend, which is already delivering returns of 177.07% over the last 12 months.
Disclaimer: This analysis is for informational and educational purposes only. The cryptocurrency market is highly volatile. This does not constitute financial advice or an invitation to invest. Conduct your own research before making capital decisions.
Communications Professional. Crypto Enthusiast. Economic Journalist. Bitcoiner & Altcoiner.