In a context marked by global volatility, Tether Dominance (USDT.D) is losing ground. Following an extensive bullish cycle, investors are abandoning the safety of the digital dollar to position themselves in bitcoin and altcoins. This strategic move occurs as tensions between the U.S. and Iran reshape traditional markets: oil is rising and gold is faltering, boosting cryptocurrencies as the new risk-on haven sought by the millennial generation.
Market Pulse: USDT.D at a Crossroads
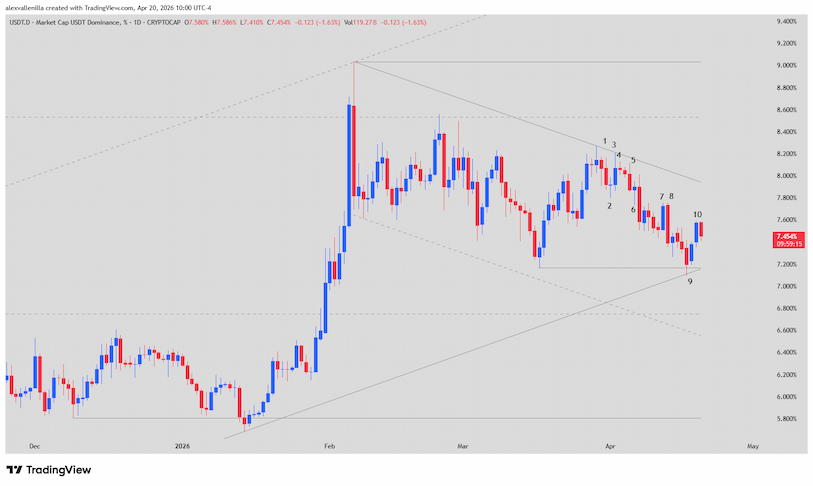
USDT dominance measures what percentage of the total crypto market value corresponds to this stablecoin. A drop in this index—as currently observed, trading near 7.449%—indicates that users are selling their dollars to buy crypto assets, injecting “fuel” into market prices.
Currently, price action is caught between loyalty to a long-term bullish trend (196 bars) and immediate pressure from a secondary bearish channel that has already seen 73 days of activity.
Technical Analysis: Anatomy of the Bulls’ Capitulation
Recent price action behavior on the daily (1D) chart reveals a power struggle where sellers (bears) seem to have taken the wheel. Below, we break down the technical narrative:
Bars 1 to 3 (The Initial Deception): Bar 1 set up a sell signal (Low 2), but its structure with long wicks showed indecision. Although Bar 2 triggered the sell, Bar 3 swept the bears’ stop losses by breaking above the previous high, though it ultimately validated the secondary channel’s bearish trendline.
Bars 4 to 6 (Confirmation of Weakness): Following a neutral phase in Bar 4, Bar 5 presented a new selling opportunity (Low 2). Unlike the first attempt, the bulls were unable to regain ground this time. Bar 6 triggered the final drop, breaking the congestion and confirming that liquidity was exiting USDT.
Bars 7 and 8 (The Authority Blow): Bar 7 attempted a bullish bounce that turned out to be a “bull trap.” Bar 8 quickly responded with a solid body and no wicks, demonstrating total selling conviction.
Bars 9 and 10 (Critical Support): Bar 9 tested the key support level at 7.156%, where the previous low and the lower line of the main bullish channel converge. Bar 10 completed a two-bar pullback which, while bullish, lacks significant volume to reverse current pressure.
Projected Scenarios: Where is Capital Heading?
The technical structure suggests a Spike and Channel pattern, which typically precedes the exhaustion of the major trend.
Scenario A (Bullish Recovery): If USDT.D successfully defends the 7.169% support and breaks the dynamic resistance at 7.943%, bulls will target the 8.269% high. This would indicate that the market is returning to the safety of stability, pausing the crypto rally.
Scenario B (Bearish Breakout – “Altseason”): If bears pierce the 7.169% support, it would break the long-term bullish structure. The next target would be the dynamic support at 6.551% and, eventually, 5.808%. This is the dream scenario for bitcoin enthusiasts, as it implies a massive entry of capital into the market.
Scenario C (Compression and Volatility): The confluence of forces could trap price in a wide range between 8.532% and 6.749%, generating erratic movements before a clear definition occurs.
USDT dominance is sending a clear signal: the fear of missing out (FOMO) on low bitcoin prices is outweighing the fear of geopolitical uncertainty. Although the long-term trend remains intact, the weakness shown since Bar 1 suggests that investors are ready to take on risk in search of yields that digital cash no longer offers.
Disclaimer: This analysis is for informational and educational purposes only. It does not constitute financial advice or investment recommendations. Trading crypto assets carries significant risk.
Communications Professional. Crypto Enthusiast. Economic Journalist. Bitcoiner & Altcoiner.