On a day marked by extreme volatility, the native token of the Sui network (SUI) captured analyst attention after executing an explosive breakout from its consolidation range. With a rally reaching 24.50% in a single session, the asset successfully cleared the psychological $1.3025 barrier—a level that historically served as critical support before the capitulation of the secondary downtrend. Despite optimism fueled by recent announcements regarding private transactions and fee-free stablecoin transfers, the market remains on edge: Are we witnessing the start of a major trend reversal or simply a sophisticated trap in a market still carrying 68% year-to-date losses?
Technical Analysis: Anatomy of the Liftoff
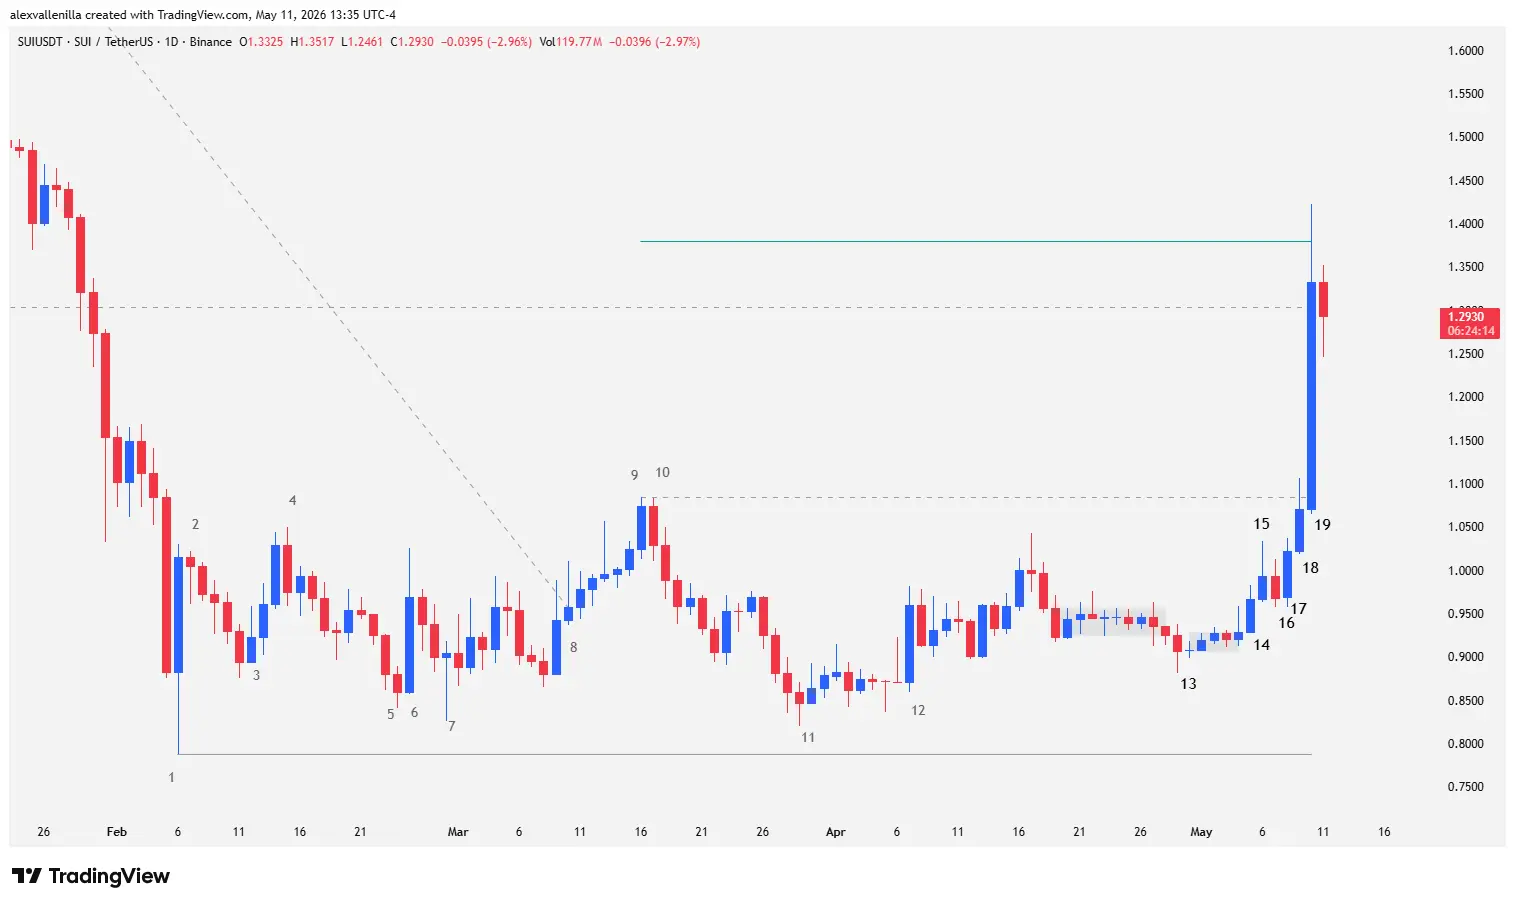
Price action on the SUI daily chart (1D) reveals a narrative of institutional accumulation and supply absorption that culminated in the recent volatility explosion. Below, we break down the technical behavior through bar analysis:
Bars 13 and 14 (The Prelude): Bar 13 attempted a bearish breakout that quickly lost traction, turning into a congestion zone. After five sessions of indecision, Bar 14 broke above this sideways pattern, signaling the return of buying pressure.
Bars 15 and 16 (The Battle at Resistance): Bar 15 confirmed the breakout but closed as a pin bar with a pronounced upper wick, showing that bears were aggressively defending $1.0846. Bar 16 attempted a bearish reversal, but its inability to close below the previous low suggested selling weakness.
Bars 17 and 18 (Reversal Failure): The 5.53% move in Bar 17 invalidated any immediate bearish scenario. This “reversal failure” attracted new buyers, leading Bar 18 to retest Bar 9 resistance ($1.0846), though it failed to close above it.
Bar 19 (The Master Breakout): This massive 24.50% candle broke resistance with authority. Its structure—featuring almost no lower wick and zero overlap with the previous session—indicates a massive capital inflow. The price reached a measured move equivalent to the range size between Bar 1 and Bar 9, hovering slightly above $1.3038.
Structure and Context: Where is SUI Headed?
SUI currently sits at a structural crossroads. Although it successfully exited a local trading range, it still operates under the shadow of a major 491-bar downtrend.
Clearing the $1.3038 zone (former support turned resistance) is a significant milestone; however, to confirm a paradigm shift, the price must target and consolidate the next resistance at $2.0244. At the time of this report, the asset trades at $1.2930, forming a small bearish inside bar that reflects natural profit-taking following the vertical impulse.
If bulls fail to flip $1.30 into a solid floor, the risk of a retracement toward $1.0882 support increases considerably, maintaining the “bull trap” structure within the dominant bearish cycle.
Market Close
SUI demonstrates enviable technical resilience over the past month, accumulating 37.06% gains. However, caution remains the golden rule: the macro trend is still bearish, and only a sustained close above $2.02 would validate a new long-term growth cycle for this Layer 1 giant.
Disclaimer: This analysis is for informational and educational purposes only. Cryptocurrency trading involves high risk. This does not constitute financial advice or an investment recommendation.
Communications Professional. Crypto Enthusiast. Economic Journalist. Bitcoiner & Altcoiner.