A razor-thin tug-of-war is unfolding on the Bitcoin daily (1D) chart. Following a sharp correction, price is desperately searching for a dynamic floor, while sell algorithms defend the 20-period exponential moving average (20 EMA). The bears’ inability to trigger a high-probability pattern opens the door for a reversal structure that institutional traders are watching under a microscope.
The Anatomy of the Bounce: Price Breathes
The crypto ecosystem faces a crucial technical consolidation phase. After a bearish impulse pushed price action to test critical zones, the current structure points to potential accumulation.
Bears maintain short-term macro control, but order flow shows signs of exhaustion. The core action centers on the magnetic respect for $60,000, a psychological and technical zone aggressively defended for 135 bars.
Price Action Breakdown: Candlesticks Under the Microscope
A sequential analysis of the last seven sessions reveals the psychological behavior of smart money and market order flow:
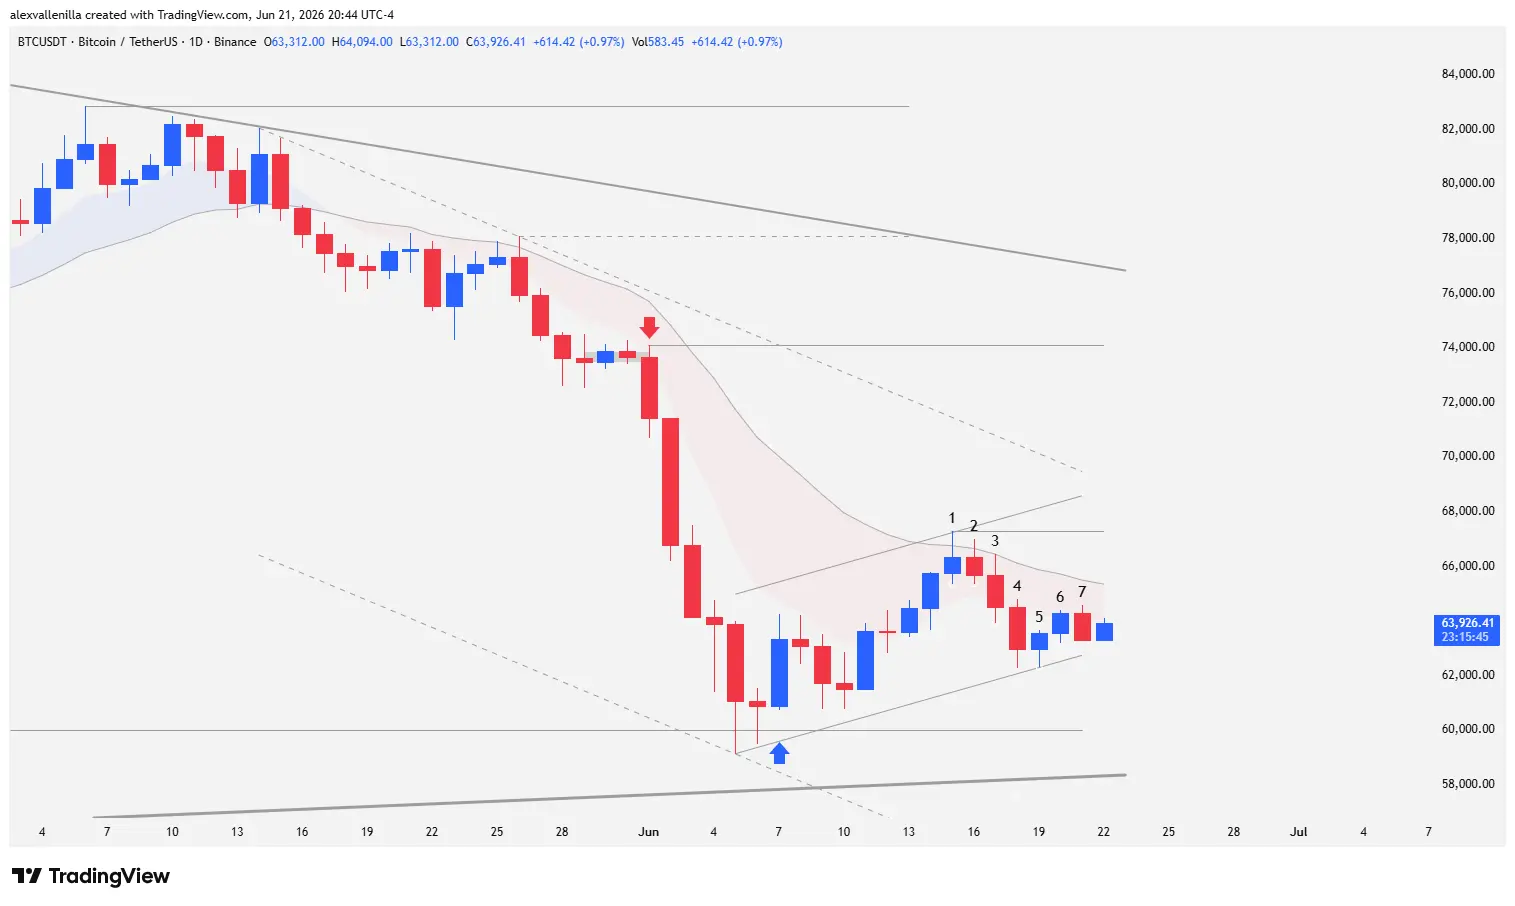
Bar 1 (Stall and Bullish Attempt): This small pinbar candlestick with a bullish close caps a moderate six-bar move. Price briefly pierces the 20 EMA, but the upper wick confirms seller rejection at that level. The narrow body exposes a clear bearish deceleration, establishing fixed local resistance at $67,292.
Bar 2 (Consolidation): An inside bar reflecting indecision. Bulls temporarily cede control, and price remains trapped below the 20 EMA.
Bar 3 (Bearish Continuity): Sellers take the initiative and break the low of Bar 2, resuming downward pressure in a controlled manner.
Bar 4 (Climatic Acceleration and Low 2 Setup): This bearish candle expands its range dynamically. Its body, noticeably larger than Bars 2 and 3, signals a climatic liquidation move. Technically, it sets up a classic, high-probability Low 2 short pattern (the second failed attempt at a bullish bounce within a markdown). However, the low of this bar prints a higher low relative to the initial bullish impulse. Sitting so close to key support, shorting here carries elevated risk, limiting setups to tight scalping plays.
Bar 5 (The Internal Pivot): Another consolidating inside bar. Bears fail to breach the low of Bar 4, meaning short sell orders never triggered. Instead, the low of this candle serves as the foundational anchor to plot a counter-trend bullish microchannel projecting into the current structure.
Bar 6 (Persistence Without Confirmation): Buyers extend the reversal started in the previous candle. However, the move lacks the strength to violate the high of Bar 4. Consequently, the Low 2 short structure remains technically valid for the bears.
Bar 7 (Congestion at the 20 EMA): A controlled pullback halts bullish momentum, keeping price compressed under the 20 EMA. The silver lining for the bullish structure is that price finds a base above the microchannel trendline. The market enters a state of congestion and volatility compression.
Macro Structure: The Roadmap for the Coming Days
The daily chart provides a highly compelling medium- and long-term perspective. Although the 20 EMA repelled the first recovery attempt on Bar 1, the rejection lacked the volume characteristic of aggressive institutional selling. This triggered the current sideways price action.
Technically, the Low 2 structure from Bar 4 hangs by a thread. If Bitcoin price climbs and clears the high of that bar, the pattern fails immediately. A failed Low 2 triggers a buy signal. A convincing close above the 20 EMA will activate an institutional buy setup, developing a two-legged pullback derived from the broader bounce.
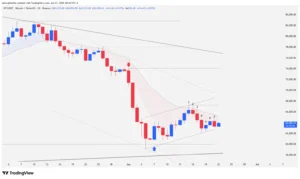
On a macro scale, price perfectly validates support at $60,000. This behavior builds a double bottom pattern within the macro context. Crucially, this support coincides with the dynamic base of a long-term bullish channel (spanning 1,271 bars), with its dynamic support sitting at $58,350.
Key Scenarios
Bullish Scenario: A solid breakout above local resistance at $67,292 (Bar 1 high) completely invalidates the immediate bearish bias, clearing the path to test all-time highs in the $74,100 zone.
Bearish Scenario: If the 20 EMA breaks the buyers’ backs and the counter-trend microchannel collapses, order flow will push price to retest critical support at $60,000. Cleancut capitulation below this level forces a liquidity hunt at $58,350.
Bitcoin remains compressed in a zone of high technical friction. The bears’ failure to pull the sell trigger below Bar 4 suggests that macro support at $60,000 holds high buy-order density. The breakout from this congestion will define the market trend for the next quarter.
Disclaimer: This analysis is for educational and informational purposes only and does not constitute financial advice or an invitation to invest. Trading crypto assets involves substantial risk of capital loss.
Communications Professional. Crypto Enthusiast. Economic Journalist. Bitcoiner & Altcoiner.