Worldcoin (WLD) bulls face a direct battle against institutional sell orders on the daily chart. Following an impressive 96.96% quarterly rally and a 33.28% year-to-date gain in 2026, WLD price action enters a decisive structural phase inside its ascending channel. The market processes profit-taking at key resistance while investors evaluate whether the recent pullback constitutes solid accumulation or a sophisticated trap for late buyers.
Market Structure and Macro Context: Buyers Retain Control
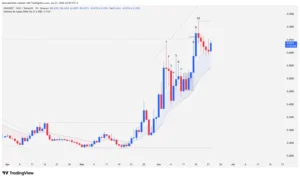
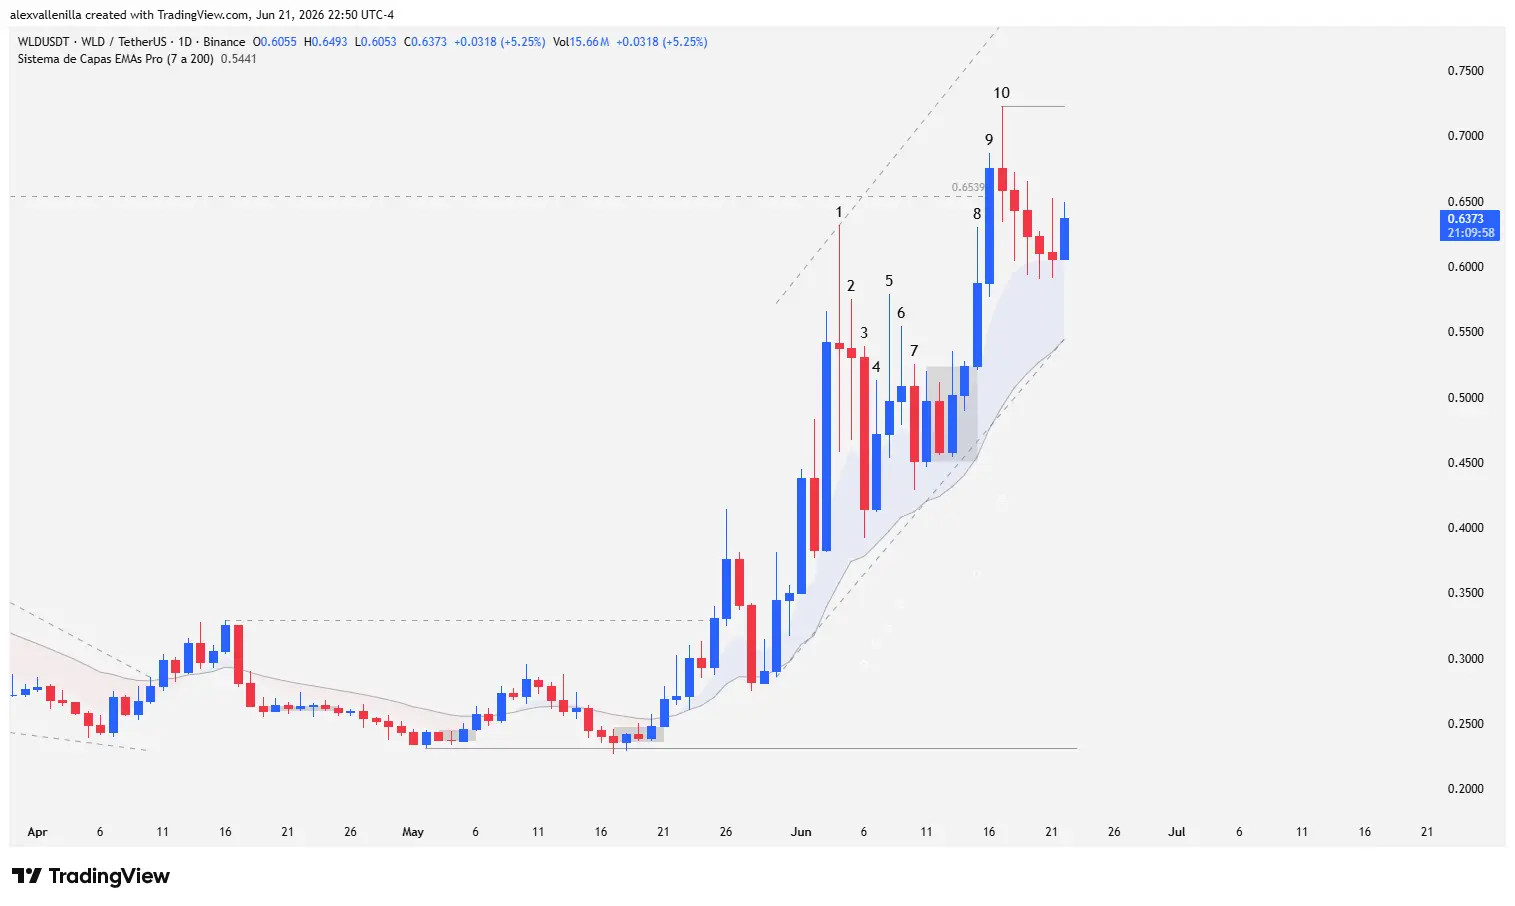
The daily chart order flow reveals a predominantly bullish bias extending across the last 23 trading bars. The asset develops a high-fidelity ascending channel, technically validated by the behavior of the 20-period Exponential Moving Average (EMA 20).
Throughout this impulse, price has not directly tested this dynamic indicator, demonstrating the firm conviction of institutional smart money. With this performance, WLD drastically reduces its year-over-year losses to -26.19%, transforming general capitulation sentiment into a scenario of strategic optimism. However, price reaching upper liquidity zones has begun to trigger fatigue alerts.
Bar 1: A high-volatility doji abruptly interrupts a prior strong bullish impulse. This session’s high fails to test the key resistance at $0.6539 (the peak of the last structural downward move). The session records an aggressive battle between supply and demand, characterized by massive profit-taking from commercial traders.
Bar 2: This prints as an inside bar with a lower-range doji body. The market enters a brief state of temporary equilibrium and volatility compression.
Bar 3: Smart money executes massive sell orders, printing a bearish candle of firm conviction. Despite aggressive supply, the session low fails to test the EMA 20, establishing a higher low. Bears also fail to breach the low of the previous bullish intent candle, confirming the move is a healthy pullback after two short-term upside legs.
Bar 4: A new inside bar halts the bearish continuity of the previous session. Buyers absorb the sell order flow, defend the developing ascending channel, and keep the price above the EMA 20.
Bar 5: Demand attempts to regain the initiative, but the session closes printing a pinbar with a massive upper tail that triples the size of the real body. Sellers aggressively liquidate the top of the range. However, the order flow reveals a crucial technical detail: the high of bar 5 exceeds the highs of bars 4 and 3, invalidating the sell signal from bar 3. By closing below the high of bar 1, the chart signals a loss of momentum.
Bar 6: Another inside bar consolidates price with decreasing volatility. The persistent upper tail confirms that supply remains active, blocking upward moves. The decreasing size of the bodies in bars 4, 5, and 6 paints a clear pattern of bullish deceleration.
Bar 7: Bears push again and deliver a dropping candle that invalidates the reversal attempted in the previous two sessions. However, the low again establishes itself above the EMA 20, marking another higher low. This proves demand defends the structure at increasingly higher prices. Subsequently, a bullish inside bar moves price into a congestion zone that lasts four sessions, consistently respecting the EMA 20.
Bar 8: Buyers break the congestion. The session high breaches immediate resistance levels from the prior four days, though the closes remain below the high of bar 1 and short of $0.6539.
Bar 9: Demand provides the necessary continuity and validates the breakout of bar 8. The session achieves a technical milestone by breaking and closing solidly above macro resistance at $0.6539.
Bar 10: The attempt to extend the vertical move fails as institutional sell orders appear at highs. Bears print a pullback pinbar whose upper wick doubles the body size. By failing to reach the upper line of the projected channel, the chart emits the first serious signal of buyer weakness. The high of this candle establishes psychological and technical resistance at $0.7229. From here, price begins a four-bar correction characterized by small bodies and wicks on both ends, suggesting a minor distribution phase over support.
Technical Scenarios for Coming Sessions
The technical bias for Worldcoin remains strictly on the buyers’ side as long as price trades above the EMA 20, whose dynamic support currently sits at $0.5444.
If demand manages to re-accumulate positions above the old resistance of $0.6539, price will look to attack the bar 10 high at $0.7229 again. Breaching this level opens the floodgates toward the top of the ascending channel, targeting a medium-term objective at major resistance of $1.6990.
Conversely, if bulls fail to clear $0.7229 and the market validates a bull trap setup, price will initiate a severe corrective process designed to test the strength of the EMA 20 at $0.5444.
Worldcoin price action shows that the uptrend keeps its structure intact, but sell volume at the $0.7229 zone demands operational caution. The ability of demand to flip the old resistance of $0.6539 into a solid floor determines whether the ecosystem kicks off a new expansionary cycle or faces a deep correction toward its key moving averages.
Disclaimer: The views expressed in this article are purely educational and informative and do not constitute financial advice, investment recommendations, or offers to buy or sell digital assets. Every trader is responsible for their own risk management.
Communications Professional. Crypto Enthusiast. Economic Journalist. Bitcoiner & Altcoiner.