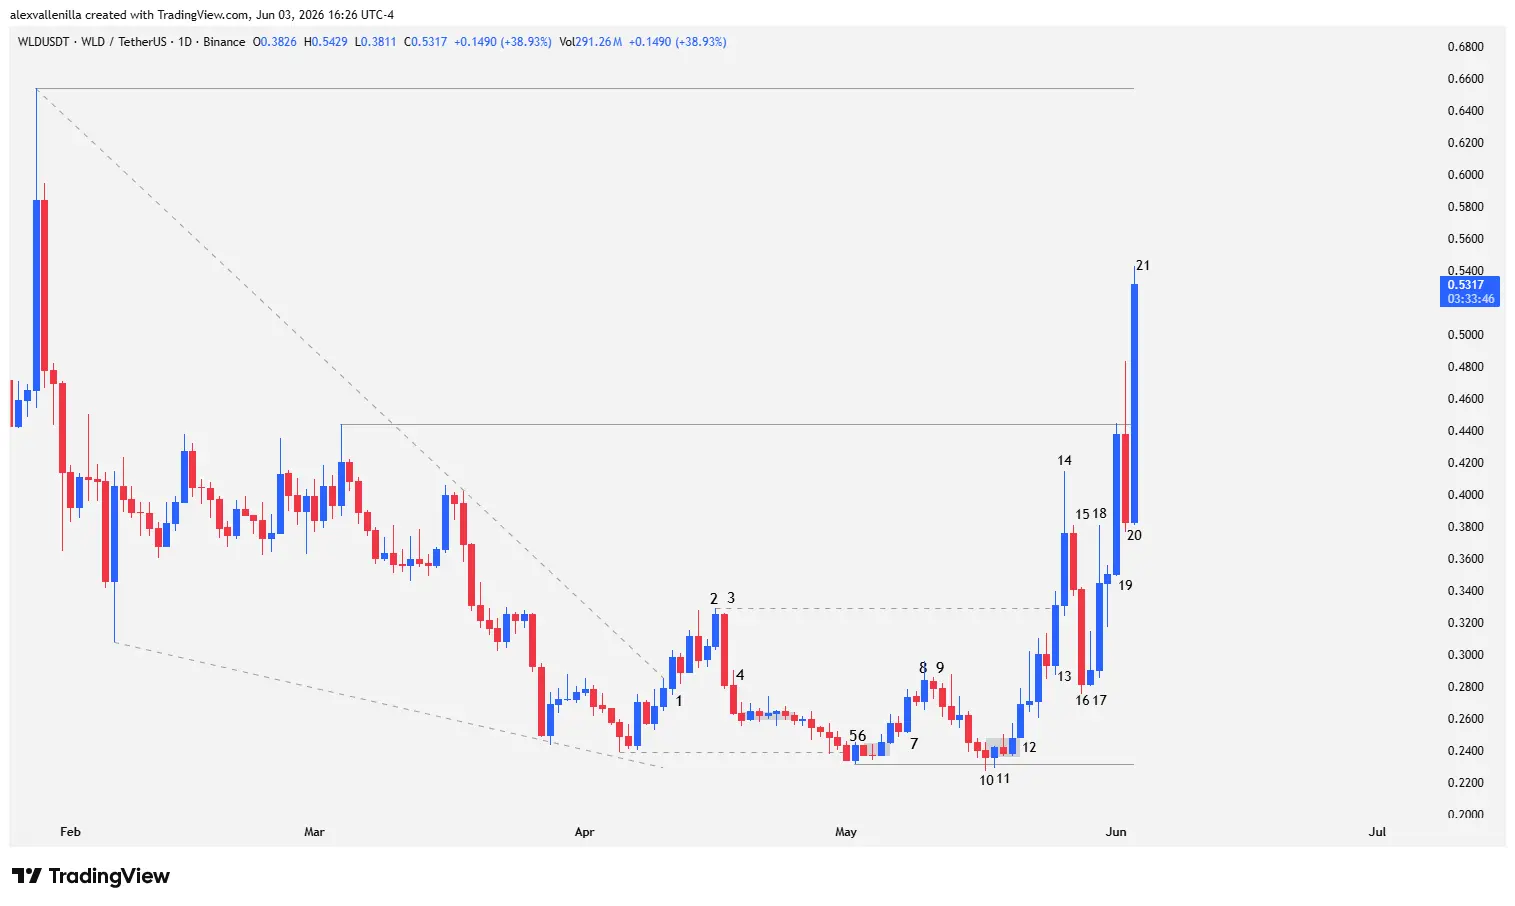
Price action on the Worldcoin (WLD) daily chart just triggered alarms for high-frequency trading algorithms and institutional traders. Following a 72-session downtrend locked beneath a descending wedge structure, the order flow completely flipped. Today’s session (Bar 21) registers a vertical bullish acceleration of 38.39%, trading at $0.5320 and decisively piercing through macro resistance at $0.4439. This move not only invalidates the bull traps from recent days but completely redefines medium-term market structure, opening up liquidity toward heights not seen in months.
Anatomy of the Breakout: From Descending Wedge to Bear Capitulation
To understand the magnitude of WLD’s current move, mapping out the prior liquidity backdrop is imperative. The cryptocurrency had been trapped beneath the upper boundary of a descending wedge—a classic exhaustion pattern representing the final bearish leg of a contractive macro cycle.
The first signal of a structural shift occurred at Bar 1, which executed the initial breakout of the 72-bar descending trendline. However, financial markets rarely hand out profits without testing trader conviction first. Smart money and market makers initiated a complex reaccumulation process characterized by ultra-high volatility and traps at both ends of the order book.
Anatomy of Price Action: The Tug-of-War Between Smart Money and Residual Supply
Chronology of Key Structures in WLD/USDT (1D Chart):
Technical development following the initial breakout reveals a bar-by-bar war of psychological attrition:
Bars 2 and 3 (The Bear Counteroffensive): The high of Bar 2 established early resistance at $0.3291. Although the initial bullish impulse saw activity from “strong hands” (wide-range candles with wicks sweeping opening-to-closing volatility), bears sold aggressively. This materialized in Bar 3, a massive bearish candle that plummeted 13.74%. By covering almost its entire range with a real body, it confirmed the presence of institutional order blocks on the supply side looking to hunt early buyers’ stop-losses, though it failed to violate the low of Bar 1.
Bars 4 to 6 (The Bear Trap at Support): Following Bar 4, price entered a severe compression phase known in price action methodology as “barbed wire” for six sessions. The subsequent downside breakout attempt led price to test critical support at $0.2389 (Bar 5). The response arrived immediately at Bar 6: a stinging support breakout failure that trapped late breakout sellers, establishing a new, corrected structural low at $0.2311.
Bars 7 to 11 (Silent Absorption): Bar 7 validated the influx of institutional buying. Order flow efficiently covered the session’s entire range to the upside. Even though Bar 8 showed profit-taking with a long upper wick as it approached previous resistance at $0.3291, and Bars 9 and 10 (the latter a tiny-bodied Doji that pierced $0.2311 by wick only) attempted to regain control, the bears’ lack of conviction betrayed the exhaustion of floating supply.
The Launch: Efficient Momentum and Absorption of Residual Supply
The true injection of expansive volatility began at Bar 12, characterized by a shaved bottom open—an unmistakable sign that buyers dominated the auction from the first second of trading. Following a brief inside consolidation and an absorption pinbar, the market delivered Bar 13, a highly efficient wide-range candle that closed slightly above resistance at $0.3291.
Expansive confirmation arrived with Bar 14, a climatic bullish acceleration candle gaining 13.68%. Its massive range attracted selling at the highs (leaving an upper wick equivalent to 30% of the bar), forcing a healthy round of profit-taking.
This technical correction played out through Bar 15 (inside consolidation) and Bar 16, a massive 17.52% bearish candle with no upper wick and a close near its lows, reflecting short-term institutional selling pressure. Nonetheless, the drop was abruptly halted by Bar 17 (an inside rebound candle) and reversed by Bar 18, which expanded 18.77% upward, completing a technical resting zone to project a two-leg measured move symmetry.
Today’s Session: Short Squeeze and Macro Projection
The technical thesis of market symmetry played out with surgical precision. Bar 19 catapulted the price by 24.99%, halting down to the millimeter at key resistance of $0.4439—the final relevant lower high of the previous downtrend.
Though Bar 20 triggered market panic by simulating a bull trap—featuring a massive upper wick and a bearish close below 50% of the preceding candle’s body—today’s session completely crushed the bears’ game plan.
Bar 21 (today’s session) is currently staging a vertical 38.39% rally, trading at $0.5320. The sheer violence of the move points to a short squeeze combined with institutional-scale breakout buy orders. By trading convincingly above $0.4439, WLD is shifting its long-term structure from bearish to bullish.
A Technical Paradigm Shift
Current price action in Worldcoin is not a simple speculative bounce inside a range; it is a full-fledged structural breakout. If Bar 21 secures its daily close above the $0.4439 level, this former resistance will flip into the asset’s new macro support floor.
From a strict order flow and crowd psychology perspective, the path is cleared of significant technical resistance up to the $0.6539 zone, a level matching the origin peak of the 72-bar downtrend. Bulls have seized institutional control of WLD.
Disclaimer: This technical analysis is issued solely for informational and educational purposes. It does not constitute, under any circumstances, investment advice, financial recommendations, or an offer to buy or sell digital assets. Cryptocurrencies represent highly volatile and risky instruments; every trader must conduct their own due diligence (DYOR) before committing capital to the market.
Communications Professional. Crypto Enthusiast. Economic Journalist. Bitcoiner & Altcoiner.