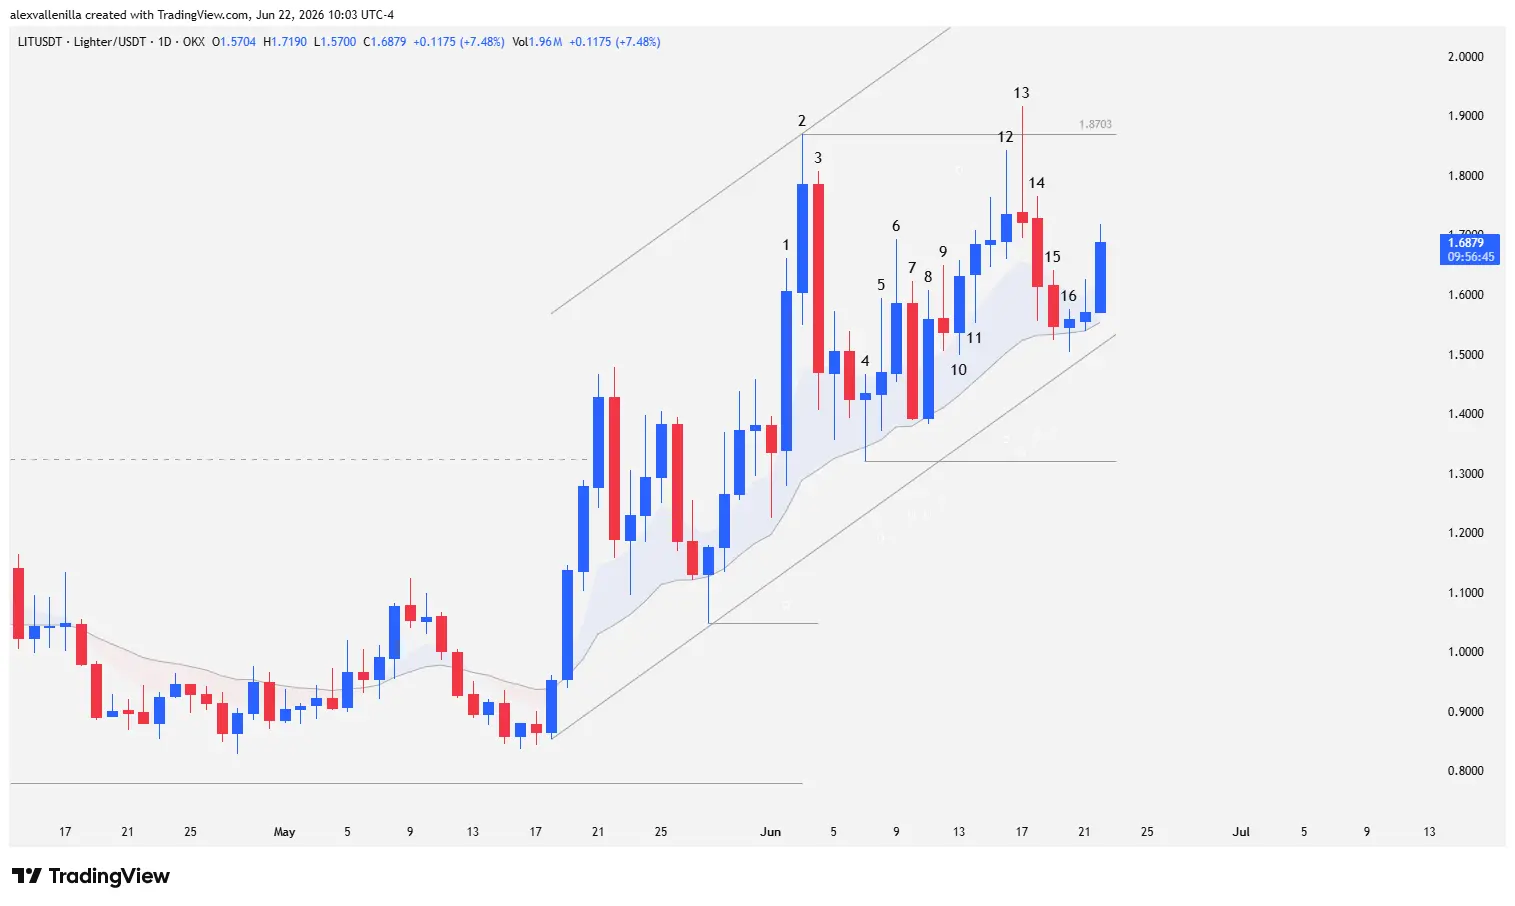
The digital asset market is turning its eyes back to Lighter (LIT). The cryptocurrency posts a remarkable recovery of 44.31% over the past month, easing the bearish pressure that dragged down its annual performance, where it still registers an 11.28% loss. At the time of writing, LIT trades at $1.68, holding a short-term bullish structure supported by the 20-period exponential moving average (20 EMA). However, the price compresses drastically against a fundamental technical and psychological resistance. Buyers must break this level to validate a macro trend reversal.
Price Action: Order Flow Breakdown on the Daily Chart
Structured technical analysis over recent sessions reveals an intense liquidity transfer between market “smart money” and retail supply. Pure candlestick reading identifies the following narrative:
Impulse Phase and Resistance Establishment (Bars 1 to 3)
The trend kicks off with Bar 1, a high-conviction bullish impulse that validates buying bias. Bar 2 provides continuity to the move, though it prints wicks on both ends, signaling emerging volatility; nonetheless, its high establishes a fixed resistance at $1.8703, also anchoring the top of a 36-bar ascending channel. The bearish response follows immediately: on Bar 3, sellers aggressively enter with a strong rejection candle at that resistance, executing institutional profit-taking.
Compression and Retracement Failures (Bars 4 to 11)
Bears quickly lose traction. Bar 4 prints a supply-absorbing pinbar that tests the 20 EMA, proving a lack of downward continuity. After a bullish attempt halted by upper wicks on Bar 5, Bars 6 and 7 show an accelerating pattern in body size, which typically precedes corrections.
Even though Bar 7 attempts to reclaim downward control, its low fails to even touch the 20 EMA. Bar 8 immediately invalidates this move by engulfing almost the entire prior body, trapping late sellers. Following a drop in volatility on Bar 9 (an extremely weak retracement), Bars 10 and 11 confirm consecutive retracement failures, shifting order flow control back to the buyers.
Double Top and Loss of Momentum (Bars 12 to 16)
Buying euphoria hits its limit as it nears the previous highs again. The high of Bar 12 attempts to test the resistance without success, leaving an elongated upper wick. Bar 13 marks the climax of this battle: bulls momentarily pierce $1.8703, but supply fiercely defends the zone, forcing a bearish close and printing a giant-tailed pinbar.
This severe rejection forms a “double top” pattern. Technically and psychologically, this represents structural weakness. The price failed to even reach the upper line of the ascending channel, confirming a clear slowdown or loss of momentum from demand.
Bars 14, 15, and 16 handle the retracement stemming from this double top. Although the price drops, bears fail to close below the 20 EMA, keeping the immediate structure under buyer control.
Projections: The Navigation Map for LIT
Structurally, LIT price prints higher lows that systematically compress against the $1.8703 resistance. This accumulation pattern presents two definitive technical outcomes for the coming days:
| Scenario | Key Zone (USD) | Technical Target | Psychological Meaning |
| Bullish Breakout | Clean pierce of $1.8703 | $2.0720 (All-Time High) | Total invalidation of the prior downtrend and price discovery. |
| Dynamic Invalidation | Loss of the 20 EMA | $1.5329 (Ascending channel floor) | Increased selling pressure and bears taking control. |
| Critical Static Support | Ascending channel breakout | $1.3201 (Previous static low) | Bias shifts to neutral or bearish in the short/medium term. |
For now, the current trading price ($1.68) reflects a temporary market equilibrium, supported by the 20 EMA, awaiting the volume required to definitively break the ceiling of the current structure.
Lighter stands at a macro inflection point. Buyer resilience to hold the price above the 20 EMA, despite brutal rejections at $1.8703, shows that risk appetite remains alive for this digital asset. However, the loss of momentum detected in the ascending channel demands caution: retail traders should wait for confirmed daily candle closes above resistance before assuming rally continuity toward all-time highs.
Disclaimer: The information contained in this article is presented for informational and educational purposes only. It does not constitute, nor should it be construed as, investment advice, financial endorsement, or a recommendation to buy or sell digital assets.
Communications Professional. Crypto Enthusiast. Economic Journalist. Bitcoiner & Altcoiner.