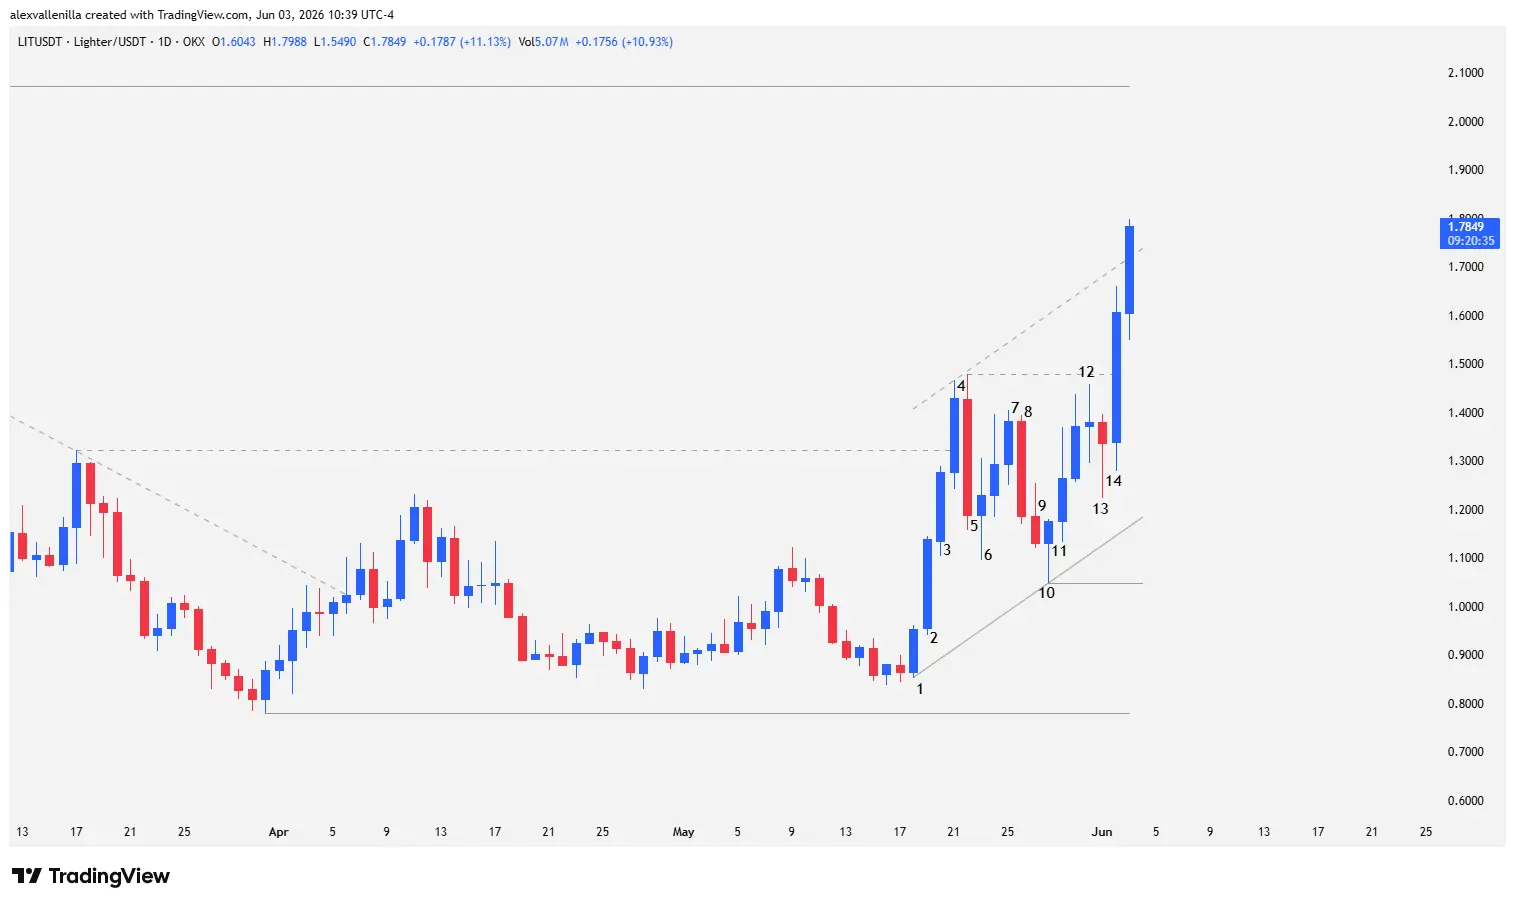
Crypto market smart money just validated a massive structural shift in the Lighter token (LIT). Following a prolonged 68-bar downtrend on the daily (1D) chart, the cryptocurrency is consolidating a dynamic transition under a classic “spike and channel” pattern. Despite posting a 7.84% year-to-date decline in 2026, LIT exhibits an aggressive 29.85% quarterly recovery and a 93.14% bullish rally over the past month. This volatility explosion places the asset right against the key $1.3230 resistance, unleashing a battle royale between institutional buy flow and the ecosystem’s most aggressive profit-taking.
From Accumulation to Breakout: The Awakening of LIT
The Lighter market completed a flawless structural transition. Price action neutralized selling inertia through massive supply absorption at lower levels, transforming the structure into a 17-bar ascending channel. This reversal is not driven by retail speculation; volume data and candlestick body anatomy confirm that institutional capital leads the charge, forcing closures above previous highs and triggering stop orders from lagging sellers.
Anatomy of the Chart: Price Action and Order Flow Reading
Bar-by-bar behavior on the 1D timeframe reveals the exact psychology of traders and the transfer of risk from weak hands to institutional funds.
The Vertical Impulse (Bars 1-4)
Bar 1: A bullish candle completely halts the previous bearish micro-channel. The lack of a direct retest of the $0.7798 structural support demonstrates buying urgency from smart money, who defended the zone early.
Bar 2: Bulls accelerate vertically with a 19.38% range expansion. The near-absence of upper or lower wicks confirms absolute control of order flow (aggressive market orders) until the final second of the session. The price breaks above the previous micro-channel peak, shattering local resistance and printing the first real footprint of institutional money.
Bar 3: Buying pressure continues with a 12.28% advance. This bar breaks a previous high established after the breach of the macro 68-bar downtrend, validating the shift in technical bias.
Bar 4: A breakout move. Although the candle body shrinks slightly compared to previous ones, it records an 11.38% appreciation. Moderate wicks on both ends denote increased volatility. The high of this bar pierces key resistance at $1.3230 (the last relevant high of the macro downtrend) while simultaneously anchoring the top of a new 17-bar ascending channel.
The Bull Trap and Consolidation (Bars 5-9)
Bar 5: Violent market reversal. An outside engulfing candle crashes the price by 16.81% in highly aggressive institutional profit-taking. Small wicks and higher volatility demonstrate selling conviction right from the open. The close prints below $1.3230 and the low of Bar 4, executing a fakeout pattern and a bull trap. It also establishes technical resistance at $1.4784. Under the persistent influence of the prior trend, bears enforce a “sell the rally” strategy.
Bar 6: A wide-range doji with extensive wicks stops the bleeding. Posting a slightly bullish close, it denies the bearish continuity of Bar 5 and confirms the failure of the selling retracement. Two subsequent reversal bars attempt to regain control.
Bar 7: A low-performance, completely overlapped candle. It shows exhaustion in buying pressure and weakness against the latent presence of supply. Although the close sits momentarily above $1.3230, the structure evidences a fierce dispute at the breakout zone.
Bar 8: Bears strike again through institutional selling flow, reactivating bull trap fears by closing below $1.3230 once more. However, the low stays higher than that of Bar 6, exhibiting a loss of bearish momentum.
Bar 9: A narrow-range selling continuity candle that validates the previous session’s pressure.
Building the Second Impulse (Bars 10-14)
Bar 10: A key bullish reversal pin bar. The extensive lower wick penetrates the low of Bar 9 but triggers massive absorption of available supply. Buyers aggressively step in at higher prices. This low acts as local support and serves as the anchor to draw the lower trendline of the 17-bar ascending channel.
Bar 11: Confirmation candle. It takes out previous highs and closes above Bar 9, trapping late market sellers in losses.
Bar 12: An overlapped doji with an almost non-existent body, denoting indecision and a lack of immediate strength to attack the resistance of Bar 4.
Bar 13: Another pin bar showing failed bearish intent. The large lower wick demonstrates that bulls are absorbing the remaining supply. The higher low precisely respects the dynamic trendline of the 17-bar channel, keeping the technical structure intact.
Bar 14: The definitive blow from smart money. A massive 20.20% expansion candle destroys resistance at $1.4784. The huge candle body mitigates any volatility and covers nearly the entire daily range. By closing with more than 50% of its body above the resistance level and the high of Bar 4, the market ratifies a textbook two-leg bullish technical move.
A Clear Path to All-Time Highs
Current price action in LIT confirms the definitive victory of buyers at the $1.3230 friction zone. The bar following the fourteenth session trades in uncharted territory, breaking above previous highs and validating the institutional breakout. By neutralizing the influence of the 68-bar downtrend through this harmonic two-leg cycle, Lighter clears the technical path to target its final bearish bastion: the all-time high (ATH) located at $2.0720.
Disclaimer: This analysis is strictly informative and educational, based on the asset’s current price action. It does not constitute financial advice or investment recommendations. Crypto assets present high volatility; manage your own risk.
Communications Professional. Crypto Enthusiast. Economic Journalist. Bitcoiner & Altcoiner.