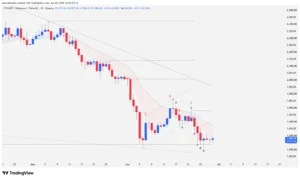
The cryptocurrency market is experiencing hours of high technical tension. During recent sessions on the daily chart (1D), Ethereum (ETH) consolidated a cumulative decline of 21.54% over the past month and 35.10% over the last 12 months. Following a failed breakout attempt above the 20-period exponential moving average (20 EMA), price structured a two-legged pullback that currently pressures a historical 433-bar structural support zone at $1,537. Bearish supply maintains control of the primary medium-term trend (166 bars), but the accumulation of buy orders at historical lows opens the door to a massive reversal scenario if the current chart pattern fails.

Macro Structure: The Wedge Dilemma and Three Pushes
Since recording its all-time high at $4,755, Ethereum has been carving out a highly clean long-term macro structure. The price is currently recording the bottom of a third bearish push, completing a three-thrust pattern in the macro structure.
This behavior is contained within a falling wedge formation, a pattern that theoretically denotes a loss of momentum by sellers and typically precedes major bullish breakouts. However, theory must validate itself within current price action. The risk of capitulation remains active, and the market is caught in a vortex where bears defend the primary trend and bulls absorb supply at critical support.
Technical Price Action Analysis
To understand current trader psychology, we must dissect the narrative bar by bar on the daily chart (1D). Order flow reveals a fierce battle within the range between $1,537 and $1,779.
The 20 EMA Rejection and the Bull Trap (Bars 1 to 4)
Bar 1: The market was coming off a consolidation phase. The previous bar attempted to break above the 20 EMA but failed. Bar 1 prints as an inside doji, immediately introducing doubt into the market. Its high fails to test the top of a short-term counter-trend bullish microchannel, and the close below the 20 EMA confirms buyers’ weakness.
Bar 2: Bears take the initiative. This bar closes below the low of Bar 1, formally confirming the previous session’s failed 20 EMA breakout. The move validates that the prior bullish attempt was a clear bull trap, maintaining the bearish bias.
Bar 3: Selling pressure continues, establishing a high-probability Low 2 short setup (the second attempt at a bearish resumption within a correction). However, the bar develops a lower tail nearly the same size as its body. This demonstrates that buyers are actively absorbing supply. Its low establishes local support at $1,671, serving as the lower anchor for the 16-bar counter-trend bullish microchannel.
Bar 4: An inside consolidation bar. By failing to test the low of Bar 3 and remaining within the channel, it fails to confirm the Low 2 sell signal. Bulls attempt a reversal, but price immediately stalls into a three-bar congestion phase, printing a “barbed wire” pattern characterized by horizontal overlapping and a loss of direction.
The Head-and-Shoulders and Channel Breakout (Bars 5 and 6)
Bar 5: Bulls launch a new attack to pierce the 20 EMA, but selling pressure forcefully neutralizes the move. The result is a pinbar closing below the 20 EMA, despite the high momentarily piercing it. This high establishes local resistance at $1,779 and completes a Head-and-Shoulders (H&S) chart pattern with bearish implications:
Left Shoulder: The bullish bar that started the counter-trend microchannel.
Head: The high of the bar preceding Bar 1.
Right Shoulder: The high of Bar 5, which, by printing a lower high relative to the head and closing below the 20 EMA, sends an unequivocal signal of fading bullish momentum.
Bar 6: The downside breakout of the congestion pattern triggers. Price breaks and closes below the local support of Bar 3 ($1,671), invalidating and snapping the short-term bullish microchannel structure.
The Battle at the 433-Bar Support (Bars 7 to 9)
Bar 7: Expansive volatility returns. This solid bar confirms the breakout of the channel, the congestion, and the $1,671 support, demonstrating bearish control. However, at the bottom, the low fails to test a key long-term 433-bar support. The structure preceding the left shoulder previously defended this level, meaning the chart temporarily preserves a structural double bottom. The ultra-high volatility reflects in a lower tail significantly larger than the bar body, proving that institutional buy orders are defending major support.
Bar 8: Bears win the session in terms of color but show exhaustion. They fail to close the price below the low of Bar 7. Although the low of Bar 8 reaches down to test the critical 433-bar support, it does not generate a close below it. The range features heavy overlap with Bar 7, signaling a loss of momentum and consolidation of the double bottom.
Bar 9: A new bearish attempt to fracture historical support ends in failure. Supply absorption is massive, resulting in a bullish-closing pinbar (despite its small body). Although the low momentarily pierced the 433-bar support, price rejected the zone immediately, denying the bearish continuity of Bar 8. From this point, ETH enters a clear phase of sideways trading and indecision just above support.
Projections: Key Scenarios for Traders
The price of Ethereum sits at a mathematical and psychological inflection point where either a macro pattern will invalidate or the primary trend will resume.
Bullish Scenario (H&S Invalidation)
If buyers manage to hold the price above the 433-bar support ($1,537), the first objective will be to clear the 20 EMA to target local resistance at $1,779 (the high of Bar 5).
Technical note: If price trades and closes above $1,779, the Head-and-Shoulders pattern will face complete invalidation. In price action, the failure of such a clear bearish pattern typically acts as a powerful buying catalyst due to the triggering of sellers’ stop-losses, opening the door for a rally toward the dynamic resistance of the 166-bar bearish channel, located at $1,955.
Bearish Scenario (Trend Continuation)
Since the H&S formed in favor of the primary medium-term bearish trend, the risk of a structural support breakout remains high. If the $1,537 support gives way on a daily closing basis, it will trigger a liquidation phase with an immediate target at $1,385. A loss of this latter level would deepen the freefall over the following weeks. If the macro falling wedge structure fails its bullish resolution and completes a measured move to the downside, Ethereum could seek its critical historical support located at $880.
Disclaimer: This technical analysis is issued strictly for informational and educational purposes, based on Price Action methodology. It does not constitute, under any circumstances, investment advice, financial counsel, or an invitation to trade digital assets. Cryptocurrency trading carries a substantial risk of capital loss.
Communications Professional. Crypto Enthusiast. Economic Journalist. Bitcoiner & Altcoiner.