The Ethereum market experiences a high-tension technical metamorphosis on the daily (1D) chart. Following a prolonged period of bearish dominance, a violent institutional capitulation bar sounded alarms, but simultaneously triggered buy orders sitting at discount levels. Currently, the price of the ecosystem’s second-largest cryptocurrency transitions from a long-term macro bearish structure into a local reversal phase. Bulls fiercely defend key swing lows while attempting to break the geometry of a secondary descending channel that keeps price under pressure.
Anatomy of a Capitulation: The Order Flow Exposed
To understand the current state of Ethereum, it is essential to break down the price action bar by bar on the daily timeframe. Each bar reveals the constant psychological tug-of-war between aggregate supply and institutional demand.
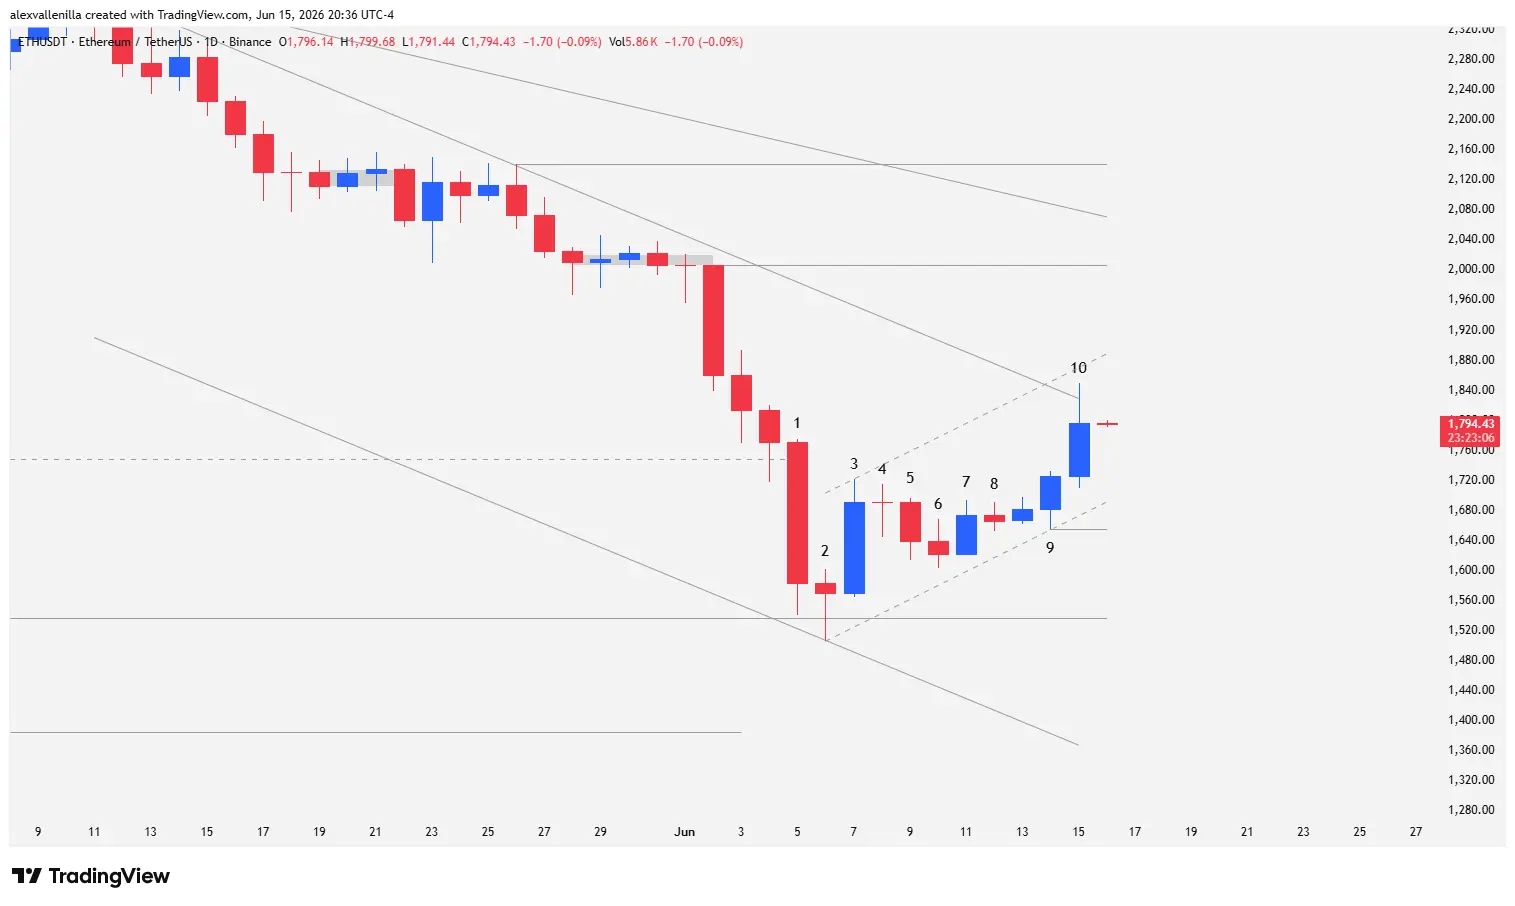
Bar 1 (The Climactic Catalyst): Sellers print an extremely wide-range, high-conviction bearish bar. This candle represents a classic strong-hand capitulation, closing very close to its absolute low. By violently breaking critical support at $1,750 (the last structural low of the downtrend), the market appeared to enter free fall. However, this bearish excess acted as a liquidity magnet for institutions looking for counterparty to absorb large volume at discount prices. A crucial detail: the low of this bar failed to touch historical support at $1,540.
Bar 2 (Failure of Continuity): A small red pinbar disrupts the momentum. Bears attempt to follow through on the previous crash and slightly pierce the $1,540 level (a static support untested for 419 bars). However, buyers aggressively defend the zone, absorbing all floating supply and stopping the selling pressure dead in its tracks.
Bar 3 (The Initial Reversal): Bulls take control with a wide-range blue (bullish) bar. This candle completely invalidates the immediate bearish bias by breaking above the highs of Bar 2 and printing a higher low.
Compression, Microstructure, and the Breakout Trigger
Following the violent initial turn, the market enters a phase of technical digestion and base building to validate the change in direction.
Bar 4 (Pause and Profit-Taking): A narrow-range inside bar. It shows indecision and a healthy pause after the verticality of Bar 3, temporarily failing to deliver immediate follow-through to the bounce.
Bar 5 (Failed Bearish Attempt): Bears attempt to regain control with a red bar. Although it follows through on the previous session’s retracement, price fails to close below the lows of Bars 2 and 3, demonstrating the absence of real sellers at the bottom.
Bar 6 (Supply Exhaustion): A small-bodied doji. The market pauses again. The close evidences that bears are running out of steam, while demand patiently absorbs the remnants of selling pressure. The low remains defensive, printing another higher low.
Bars 7 and 8 (Base Building): Two sessions of price compression. These sideways bars define a highly solid local support, structuring a micro-chain of higher lows.
Bar 9 (The Breakout Trigger): A small bullish bar breaks above the previous micro-consolidation. This move validates a short-term bullish trendline connecting the last 10 bars. The low of this session establishes key local support at $1,650. This ascending directive functions as the lower boundary of a counter-trend micro-channel, operating as a technical bounce against the primary trend.
The Critical Test: Friction at the Top of the Channel
The latest session on the daily chart clearly exposes the battle royale taking place at dynamic resistance zones.
Bar 10 (Momentum and Structural Rejection): This bullish bar expands its range notably, hitting a high of $1,850 and temporarily piercing the trendline of a 35-bar secondary descending channel. Furthermore, the high of Bar 10 exceeds the high of Bar 1, invalidating the sell signals left behind by the capitulation. However, upon interacting with the ceiling of said secondary channel, the session prints a prominent upper tail (wick) compared to its body.
Price fails to consolidate its close above dynamic resistance. The price action on Bar 10 indicates that zonal sellers remain active at the top, frustrating the bullish effort and introducing the probability of a technical retracement or a pause before a new structural attack.
Macro Perspective: Key Levels for the Trend Change
The Ethereum technical map draws a clear structural transition. The digital asset still moves inside a 153-bar primary descending channel (macro trend), which resumed after losing the $1,750 zone. In turn, the 35-bar secondary channel represents a spike-type bearish acceleration that culminated in the climax of Bar 1.
To keep the short-term reversal structure alive, price must trade above the critical support of $1,540 (near the capitulation low). If bulls manage to consolidate daily closes above the secondary channel line, the first technical target sits at $2,006, a previous horizontal resistance that coincides with a round, psychological number. Finally, the true medium-term structural trend change will only confirm if price action pierces the dynamic resistance at $2,070, the upper boundary of the 153-bar macro channel.
Disclaimer: This analysis is strictly for informational and educational purposes based on Price Action methodologies. It does not constitute, nor should it be interpreted as investment advice, financial advice, or an invitation to trade digital assets. Cryptocurrency markets exhibit extreme volatility; only risk capital you are willing to lose.
Communications Professional. Crypto Enthusiast. Economic Journalist. Bitcoiner & Altcoiner.