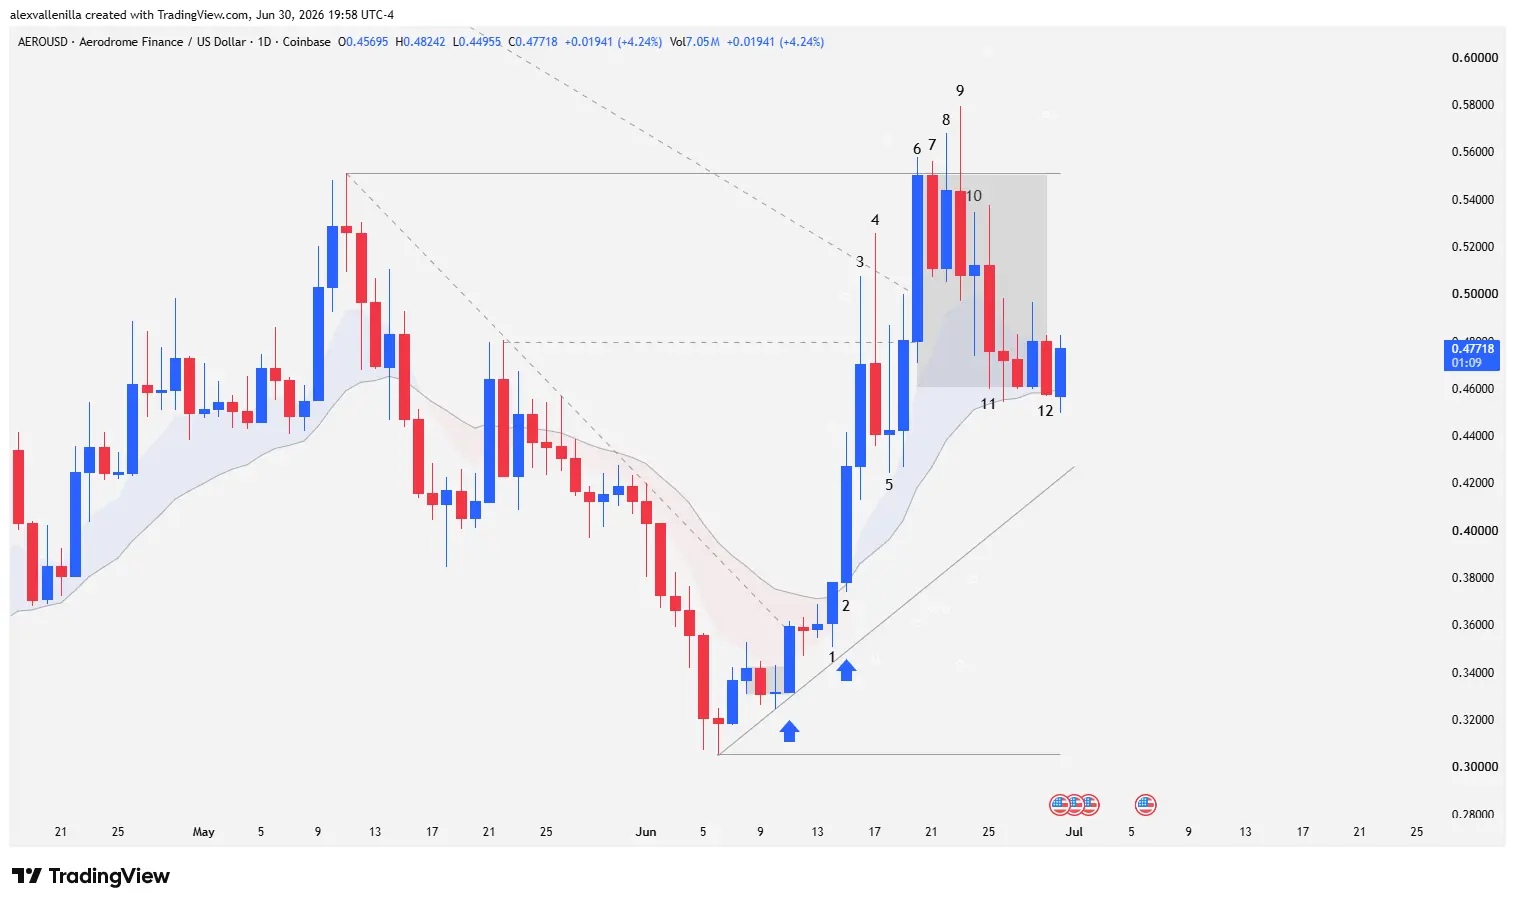
The cryptocurrency market is witnessing an all-out battle in the price action of Aerodrome Finance (AERO). After remaining trapped in a strict bearish structure for 302 bars (more than 300 days), the asset executed an aggressive bullish surge driven by institutional capital. Despite running into macro resistance at $0.5509 and experiencing profit-taking that generated a high-volatility congestion pattern, current price action reveals that bulls are successfully defending the 20-period exponential moving average (20 EMA). If demand absorbs the selling pressure, AERO could trigger a measured move to target $0.6327, transforming the current correction into a solid launchpad.
The Awakening of AERO: Macro Breakout and Volatility Shock
The technical outlook for Aerodrome Finance shifted drastically after establishing a critical low at $0.2734, a level that has not been tested in the last 139 bars. From this point, buying pressure built a higher low at $0.3055, structuring a counter-trend bullish trendline that already spans 25 bars.
The true transformation occurred when order flow swept the secondary 31-bar bearish microchannel. This move injected massive volatility into the ecosystem, forcing a “breakout crisis” scenario, where short-term traders and institutional algorithms clash directly as they attempt to define the asset’s macro bias.
Technical Analysis: Price Action Breakdown (Bars 1 to 12)
The behavior of recent sessions offers a masterclass in market psychology reflected exclusively in Japanese candlesticks and order flow:
Bar 1 (Control Breakout): An imposing bullish outside bar pierces the 20 EMA. This candle validates the strength of a previous high-conviction bar, burying the secondary bearish microchannel.
Bar 2 (Confirmation and Expanded Range): Buyers print a large-range candle that closes almost entirely above the 20 EMA. The magnitude of this body triggers the expansive volatility that defines the current context.
Bar 3 (Acceleration and Local Rejection): Price stretches aggressively and pierces local resistance at $0.4796, but latent supply prevents a close above that level.
Bar 4 (Pinbar and Breakout Failure): Bulls attack the top of the main 302-bar bearish channel. Sellers aggressively defend the dynamic zone, printing a bearish-closing pinbar. By closing below $0.4796, the market hints at a deep retracement following a failed breakout.
Bar 5 (Bearish Continuity Failure): Although the low of this candle pierces the low of Bar 4, bears fail to sustain the attack. The close is a small bullish body with a massive upper wick. With no continuity in the decline, a retracement failure is confirmed.
Bar 6 (Climactic Surge and Invalidation): “Smart money” steps onto the scene. A very high-conviction bar obliterates the $0.4796 resistance and the 302-bar bearish channel. Price breaks and closes slightly above critical resistance at $0.5509 (the last relevant major high), completely invalidating the previous bull trap. As a climactic candle following a two-legged impulse, the market enters a temporary exhaustion zone.
Bar 7 (Inside Consolidation): A bearish inside bar appears. Buyers pause the attack, resulting in an immediate failed breakout of the resistance.
Bar 8 (Second Failed Surge): Volatility expands via an outside bar. The high exceeds that of Bar 6, but bears absorb demand in a massive way, leaving a noticeable upper tail. This marks the second failure at the bullish target. Price Action theory warns: when the market fails twice at a target, it usually seeks the opposite side with force. Nonetheless, the candle temporarily nullifies the retracement of Bar 7 (failed retracement).
Bar 9 (The Failure of the Failure): Another outside bar increases tension. Bulls push the high above Bar 8, but the close is bearish with an upper wick the size of the body. This is the third failed attempt at resistance, consolidating a congestion pattern, but it invalidates the reversal of the previous session (a failure of a failure).
Bar 10 (Indecision Doji): Bears attempt to press lower, but the market balances out into a tiny-bodied doji trading within the range of Bar 9. Congestion persists.
Bar 11 (Compression on the EMA): Bears try to break down from the congestion block, but the candle is unable to close below the low of Bar 10. Price remains overlapping and, crucially, above the 20 EMA.
Bar 12 (Low-Quality Breakout): Sellers manage to close below the congestion pattern and the 20 EMA. However, the heavy overlap with Bar 11 robs the breakout of quality and conviction.
Evolution in the Current Bar: Buyers react immediately, executing a bear trap. At the time of this report, a bullish bar pushes price back above the 20 EMA, effectively invalidating the breakout of Bar 12 and trapping late sellers.
Where Price is Heading Next
AERO is in a highly healthy technical correction phase. Bars 6, 7, 8, and 9 acted as apparent resistance, but if price consolidates this breakout attempt above the 20 EMA and respects the dynamic support at $0.4268 (the 25-bar trendline), the technical structure will favor an upside explosion.
The positive resolution of this congestion will trigger a short squeeze by executing sellers’ stop losses. Under this scenario, the measured move projects the price toward $0.6327, a crucial technical level that has remained undefeated for 167 bars, formally opening the doors to a new medium- and long-term bull cycle.
Disclaimer: This analysis is strictly for educational and informational purposes and does not constitute financial advice or an investment recommendation. Cryptocurrencies are high-volatility assets; only risk capital you are willing to lose.
Communications Professional. Crypto Enthusiast. Economic Journalist. Bitcoiner & Altcoiner.