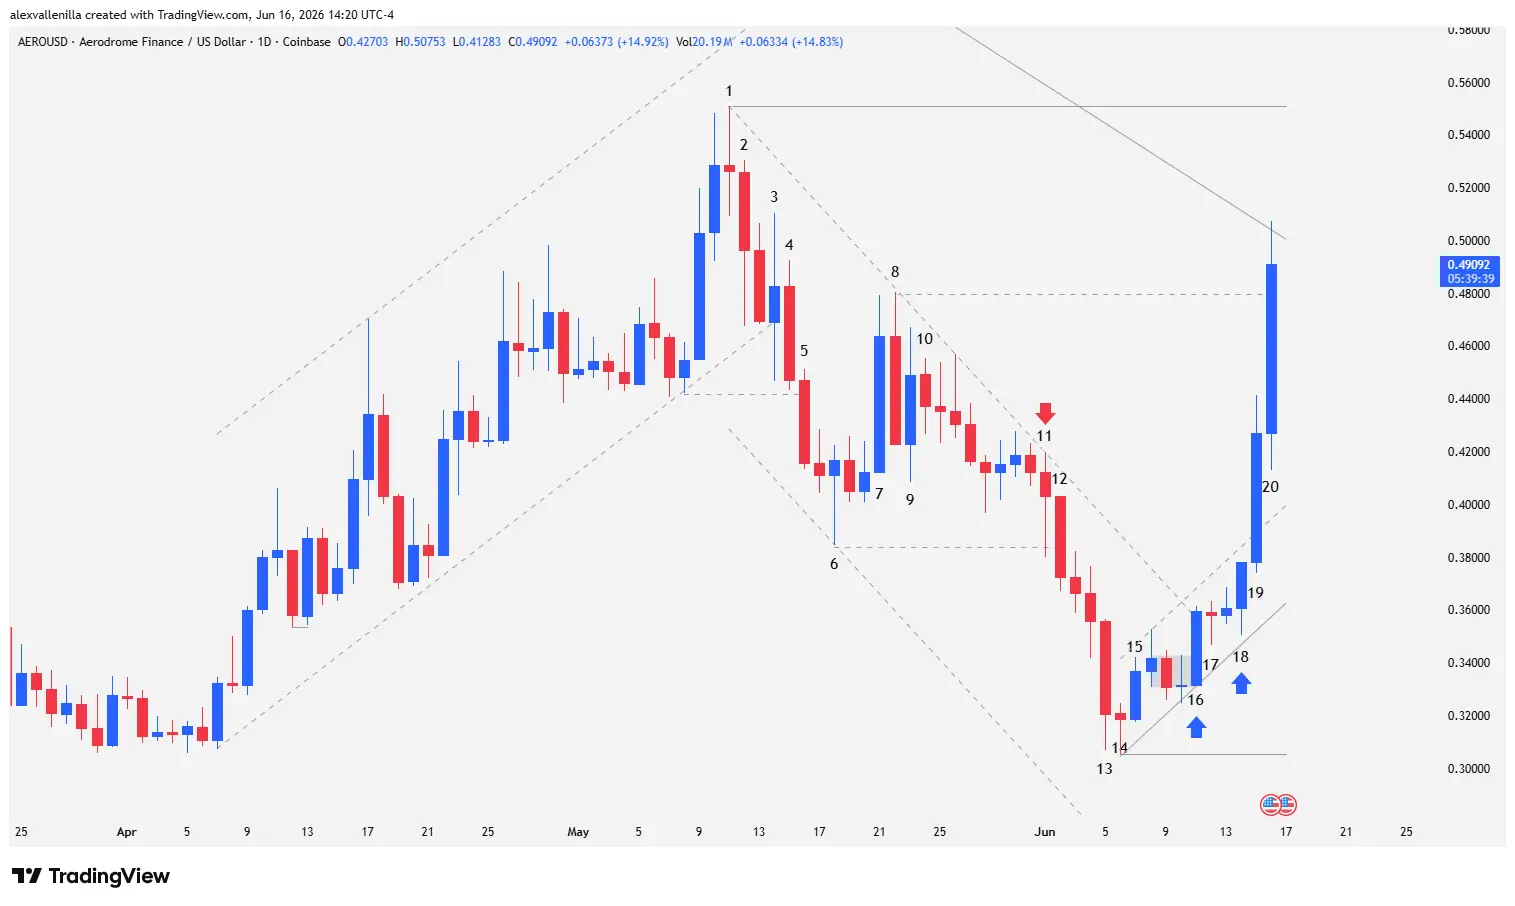
The crypto-asset market is registering significant volatility today for the AERO token (1D chart), which is experiencing an aggressive bullish rally after completing a two-legged corrective cycle. Following prolonged dominance by sellers, who have been dragging a main bearish structure of 299 bars, institutional buy orders and supply exhaustion are triggering a sharp reversal in the immediate trend. This move places the price right against two critical macro resistance zones that will define the asset’s medium-term direction for this year, 2026.
The Macro Context: A Structure Dominated by the Bears
The AERO asset has been developing a technical behavior framed within a major 299-bar bearish channel. Previous attempts to challenge the upper boundary of this structure failed systematically, consolidating distribution zones where the predominant strategy is to “sell the rally.” This structural bias conditions lower-scale movements, transforming counter-trend rallies into potential bull traps for lagging buyers. However, the internal dynamics of the order flow show recent symptoms of a structural transformation.
Exclusive Technical Analysis: Price Action Radiography (1D)
Distribution Phase and Market Structure Break (Bars 1 to 5)
Bar 1: A bearish closing doji caps off a two-legged bullish impulse. Buyers attempted to test the top of the 299-bar channel but lost momentum against the ceiling of a 37-bar counter-trend mini-channel. This set up a bull trap due to the huge effort without reward (tiny body), warning of an imminent reversal.
Bar 2: Registers a lower low relative to Bar 1, validating the weakness in buying momentum.
Bar 3: An outside bar injects high volatility. Bulls defend the floor of the 37-bar mini-channel, but the long lower wick confirms that selling pressure is looking for a breakout, leaving the buying side exhausted.
Bar 4: A bearish range candle with higher conviction. It registers a lower high compared to Bar 1 and a lower low than Bar 3. Despite the pressure, bears fail to close below local support at $0.4417 (the last relevant previous low).
Bar 5: Bears take absolute control and cleanly and solidly break the key support at $0.4417, confirming the market structure break and bearish continuity.
Absorption and Transition at the Bottom (Bars 6 to 12)
Bar 6: A deceleration pinbar establishes a new local support at $0.3838 and serves as an anchor for the lower band of a new bearish mini-channel. Buyers absorb the remaining supply at this level.
Bar 7: A high-conviction bullish candle that breaks out of a small two-bar congestion. Buy orders flow from the previous low, eliminating the lower wick, though the upper wick reveals profit-taking.
Bar 8: Bears respond strongly with a firm closing candle and no lower wick (selling in the final seconds). The high prints a local resistance at $0.4796 and fixes the first upper anchor point of a new 31-bar bearish mini-channel. The low respects the floor of Bar 7.
Bar 9: A low-conviction, high-volatility bullish reversal attempt. Its low pierces the floor of Bar 7, invalidating previous buy signals in that zone, but the price respects the support of Bar 6.
Bar 10: An inside bar consolidation that brings calm back to the market under a controlled bearish bias from the ceiling of the 31-bar channel.
Bar 11: Temporarily pierces the support of Bar 6 without closing below it. It registers a lower high against Bars 8 and 1, activating a high-probability Low 2 technical sell setup.
Bar 12: A strong bearish candle that closes below the support of Bar 6, canceling any double bottom structure. It breaks the low of Bar 11 and formally activates the Low 2 sell triggers.
Capitulation and Institutional Reversal (Bars 13 to 20)
Bar 13: A climactic capitulation candle driven by smart money accelerates the decline. The lower wick reveals heavy absorption of buy orders before hitting macro support at $0.2734 (the low of the 299-bar structure, untested in 126 periods). This confirms exhaustion and loss of momentum from sellers.
Bar 14: Registers a marginally lower low, but the price is unable to close below Bar 13. It concludes the two-legged bearish cycle within the 31-bar channel and establishes a higher floor at $0.3055.
Bar 15: Initial counter-trend reversal with a higher low and a high that easily clears Bar 14, opening the door to a sideways congestion phase.
Bar 16: First solid entry of institutional money with a high-conviction bullish candle closing at its highs. It breaks the congestion, breaches the ceiling of the 31-bar mini-channel, and starts a new 16-bar bullish trendline based on the previous higher low. Operating against the macro trend, this is classified as a high-risk entry.
Bar 17: Bears attempt an ineffective pullback that ends in a pinbar with a higher bullish low. The high triggers pending stop market buy orders resting above Bar 16.
Bar 18: An outside bar that introduces volatility but constructively sets up a high-probability High 2 buy pattern.
Bar 19: Institutional investors ratify the direction with a powerful conviction candle that skyrockets 13.10%. The close fractures the ceiling of the 11-bar counter-trend mini-channel and invalidates the resistance zones of Bar 11.
Bar 20 (Current): A large bullish climate candle in development that invalidates the 31-bar bearish structure by breaking the resistance of Bar 8. The high cleanly pierces the ceiling of the main 299-bar bearish channel, though it has not yet consolidated a close above it. Acting as a Spike-type impulse, the price risks severe profit-taking if buyers become exhausted in high-liquidity zones.
Technical Outlook
So far in 2026, AERO has accumulated a positive return of 19.88%, backed by a quarterly gain of 39.38% that mitigates the year-over-year contraction of 35.94%. Currently, the price faces a key technical crossroads against two high-hierarchy resistances: the dynamic line of the 299-bar channel at $0.5004 and the static resistance of Bar 1 at $0.5509.
Sustained consolidation above these levels would invalidate the long-term macro bearish structure, kicking off a formal accumulation phase and the construction of a new bullish trend. Otherwise, a technical rejection will force the price to seek liquidity at the immediate dynamic supports located at $0.3996 (the ceiling of the 11-bar bullish micro-channel) or at the fixed base of $0.3055.
Disclaimer: This market analysis is issued for informational and educational purposes only, based on price action methodology. It does not constitute, under any circumstances, investment advice, financial counseling, or an invitation to trade digital assets. Crypto-assets carry a high risk of volatility and capital loss. Every trader must conduct their own research (DYOR) before executing market transactions.
Communications Professional. Crypto Enthusiast. Economic Journalist. Bitcoiner & Altcoiner.