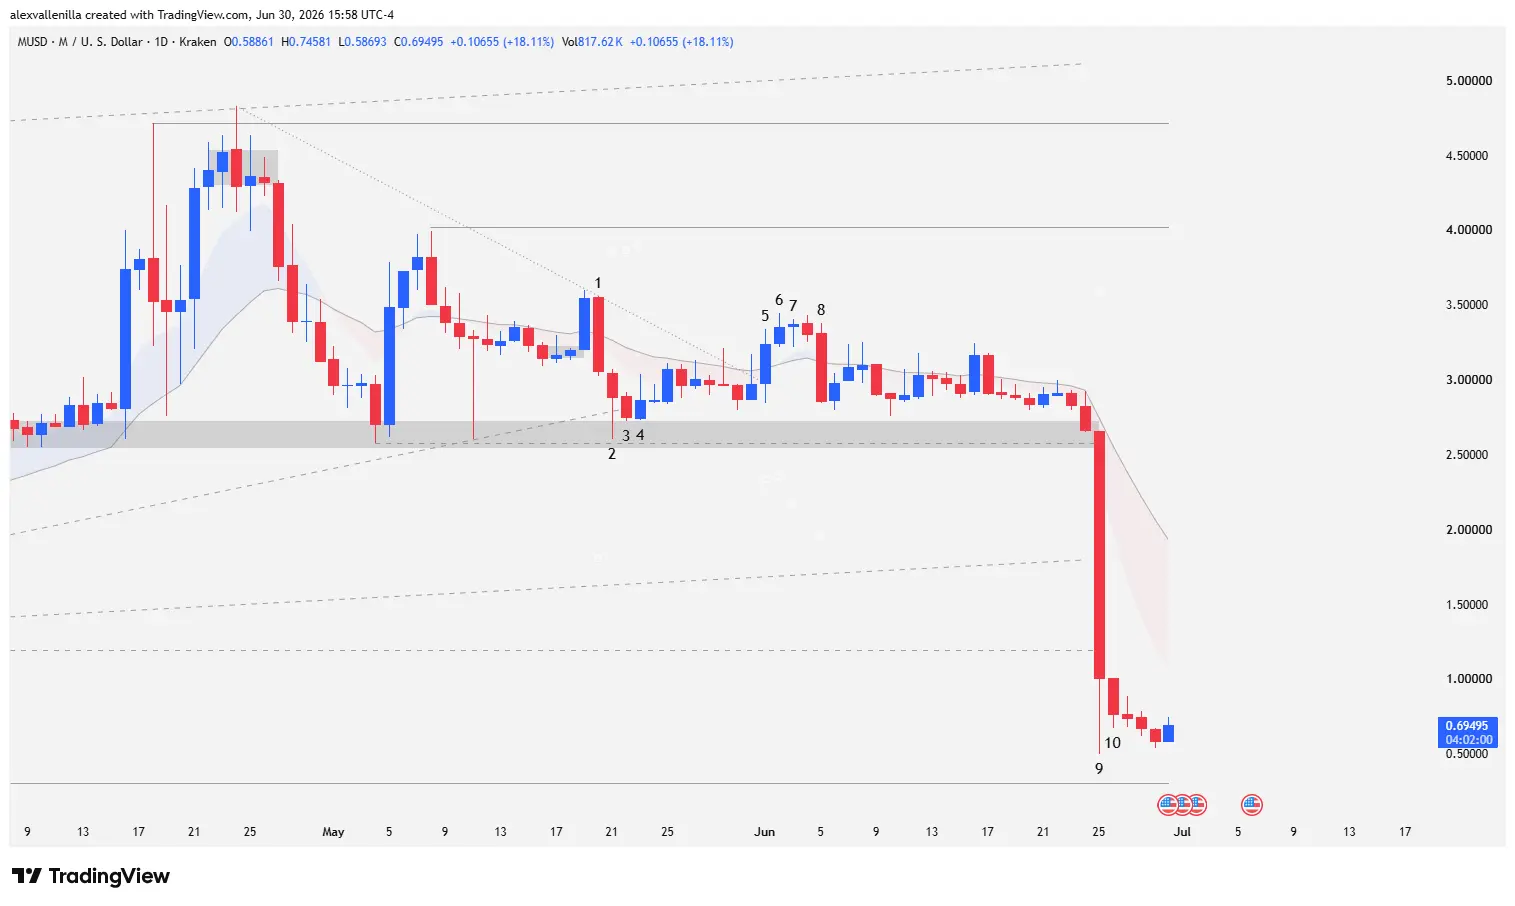
The cryptocurrency Memecore (M) suffered a staggering 62% drop on its daily chart after breaking below key support at $2.58 and cracking the trendline of a primary ascending channel that spanned 354 bars. Institutional capital liquidated buyer positions following a clear sequence of lower highs and failures at the 20-period Exponential Moving Average (20 EMA), confirming a structural shift toward a severe oversold scenario.
The Prelude to Disaster: Lower Highs and Price Compression
The Memecore (M) collapse did not happen out of nowhere; the daily chart accumulated distribution signals and demand fatigue for weeks. The bulls’ inability to hold prices above dynamic control zones triggered mass sell orders from smart money, breaking a macro structure that sustained the crypto asset.
The loss of momentum accelerated as price action began to compress against a prior congestion zone. Buyers repeatedly defended this level, but supply pushed consistently, reducing the bulls’ room to maneuver and setting the stage for a violent breakout.
Technical Analysis: The Anatomy of the 10-Bar Collapse
Bar 1: A high-conviction bearish bar invalidates the bulls’ previous attempt to breach the 20 EMA. This candle completely engulfs the prior bar, breaks its low, and drives the price back below the moving average. This failed breakout turns the high of Bar 1 into a lower high against the two previous rejected tops at the upper boundary of a 354-bar general ascending channel.
Bar 2: Bears print a pin bar with a bearish close and a notable lower wick. The price tests critical support at $2.58 for the third time—located in a prior congestion zone. The session low pierces the base of a 58-bar secondary ascending channel that supported the latest leg up.
Bar 3: An inside bar with a bearish close confirms the weakness. Bar 3 closes below the lower boundary of the 58-bar acceleration channel, invalidating the immediate bullish momentum and flashing warning signs of a structural trend change.
Bar 4: Buyers react and execute a temporary reversal, pushing the price back inside the 58-bar channel. This action increases market tension, starting a phase of sideways consolidation and compression trapped between lower highs and support at $2.58.
Bar 5: Buying pressure breaks a minor 58-bar descending trendline. The price of Bar 5 closes above the 20 EMA in an effort to resume the prior bullish structure.
Bar 6: A very narrow-range bullish bar with a small body offers continuity to the 20 EMA breakout but demonstrates demand exhaustion by failing to reach the high of Bar 1.
Bar 7: The loss of momentum becomes obvious. Bar 7 prints a lower high relative to the previous one and shows minimal volatility. Its shrinking bodies over the last three sessions (Bars 5, 6, and 7) ratify the failed bullish breakout.
Bar 8: Institutional capital takes control. Bears aggressively drive the price back below the 20 EMA via a high-conviction candle shaved at the bottom (a closing marubozu). By not immediately testing support at $2.58, the asset enters a tight horizontal trading range intertwined with the 20 EMA, building up massive pressure.
Bar 9: Capitulation. Bears print a massive, high-conviction, extended-range candle that plummets the price by 62%. Bar 9 destroys support at $2.58, invalidates the congestion zone, and breaks the base of the primary 354-bar ascending channel. Furthermore, it pierces and closes below the key $1.19 level (valid for 210 bars). A significant lower wick appears at the close, signaling institutional buy absorption before touching support at $0.31 (inactive for 336 bars).
Bar 10: The session consolidates as an inside bar with a bearish close. By posting a higher low than the previous session, Bar 10 halts the continuity of the free fall, dragging the price into a sideways phase with tiny bodies.
Market Outlook: Technical Bounce or Bearish Continuation?
The massive liquidation places Memecore in a downward overextended condition relative to the 20 EMA, which technically represents an oversold zone. The lack of immediate continuity below the low of Bar 9 opens the door for a short-term relief bounce, driven by traders looking to hunt for bargains at discounted levels.
If the bounce gains traction, the first major resistance zone sits at $1.23, a direct confluence with the downward-sloping 20 EMA. Nonetheless, the macro outlook remains delicate: if supply breaches historical support at $0.31, Memecore risks a free fall toward its absolute all-time lows in the $0.04 zone.
Disclaimer: This analysis is purely informative and educational, based on price action; it does not constitute financial advice or an investment recommendation. Crypto assets feature high volatility.
Communications Professional. Crypto Enthusiast. Economic Journalist. Bitcoiner & Altcoiner.