In a crypto market that seems to have entered a lull, MemeCore (M) decided to write its own narrative. With a 20.71% increase over the last 24 hours, the asset is not only ignoring the sideways price action of large-cap coins but is also positioning itself in a critical technical overshooting zone. Currently trading at $4.28, M carries a staggering year-to-date return of 5,924.89%, solidifying its status as an organic decoupling phenomenon driven by the meme coin sector.
Anatomy of a Rally: Between Euphoria and Technical Precision
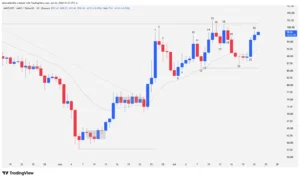
MemeCore‘s recent behavior isn’t a fluke; it’s the product of a market structure consisting of two bull legs within a larger trend spanning 290 bars. While the global market remains flat, M managed to pierce through psychological and technical resistances, backed by institutional buy-side order flow that became evident after breaking the $2.01 barrier.
This move is part of a 27-bar micro acceleration channel, where supply attempted—unsuccessfully—to regain control. Price resilience above the previous $2.97 support suggests that “strong hands” are absorbing profit-taking from retail investors, paving the way for what could be a third parabolic push.
Technical Analysis: The 12-Bar Battle
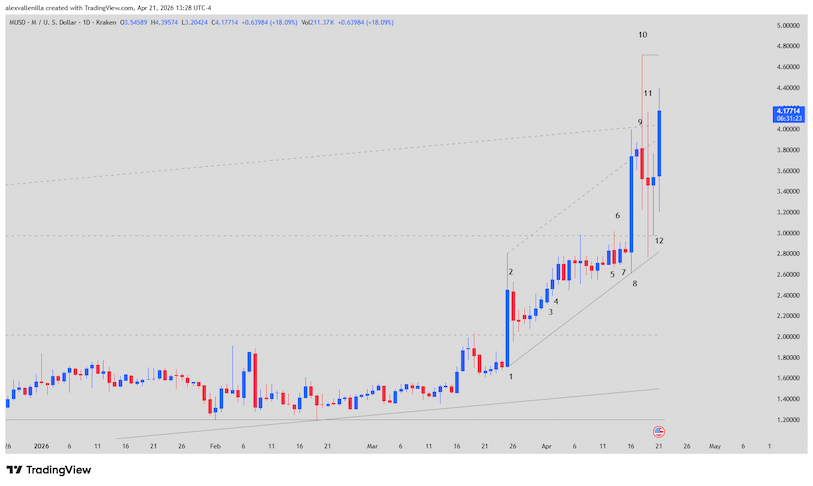
To understand MemeCore’s immediate future, we must break down the narrative told by its candlesticks on the daily (1D) chart:
Bar 1: A statement of intent. It broke the $2.01 resistance with a strong body, although the upper wick indicated a pause before testing $2.97.
Bars 2 to 4: Consolidation and re-accumulation phase. Bar 2 validated the new support, while Bar 4 attracted new buyers after breaking a brief congestion period.
Bars 5 to 7: A game of mirrors. Following indecision in Bar 5, bears attempted a reversal in Bar 6 which Bar 7 quickly invalidated (reversal failure), confirming the uptrend remained intact.
Bar 8: The catalyst. This was the most explosive move with a 33% gain, breaking the $2.97 resistance and establishing the lower trendline of the accelerated channel.
Bar 10: The first sign of exhaustion. An overshooting attempt reached an all-time high (ATH) of $4.71 but closed with a massive upper wick due to violent profit-taking.
Bars 11 and 12: High volatility. Despite Dojis and Pin Bars reflecting indecision, price held above $2.97, proving that bears lack follow-through.
Current Bar Status
At the time of this report, the daily bar shows renewed bullish momentum. Price is currently breaking above the $4.20 dynamic resistance (the top of the primary channel). If the daily close stays above this level, the probability of retesting $4.71 and entering a “price discovery” phase is extremely high.
Where is MemeCore Headed?
MemeCore sits at a high-conviction crossroads. The technical structure suggests that if it clears $4.71, acceleration could turn vertical. However, if volatility fades without breaking that level, we will likely see a sideways period before a third and final leg up. For now, the $2.97 support is the line in the sand separating optimism from a deep correction.
Disclaimer: This analysis is for informational and educational purposes only. Cryptocurrencies, especially memecoins, exhibit high volatility. This does not constitute financial advice. Conduct your own research before investing.
Communications Professional. Crypto Enthusiast. Economic Journalist. Bitcoiner & Altcoiner.