The financial market severely punishes unjustified optimism. MicroStrategy’s (MSTR) daily (1D) chart showcases a masterclass in Price Action: the long-term bearish structure maintains absolute control, crushing institutional and retail recovery attempts, and opening the door to a technical retracement toward levels not seen since early 2024.
The Anatomy of Deception: Failed Breakouts and the Bull Trap
The current MSTR narrative stems from a structural failure. The price attempted to reverse the macro dynamics, but sell order flow neutralized buyers’ initiative at key liquidity zones.
The Rejection at $197
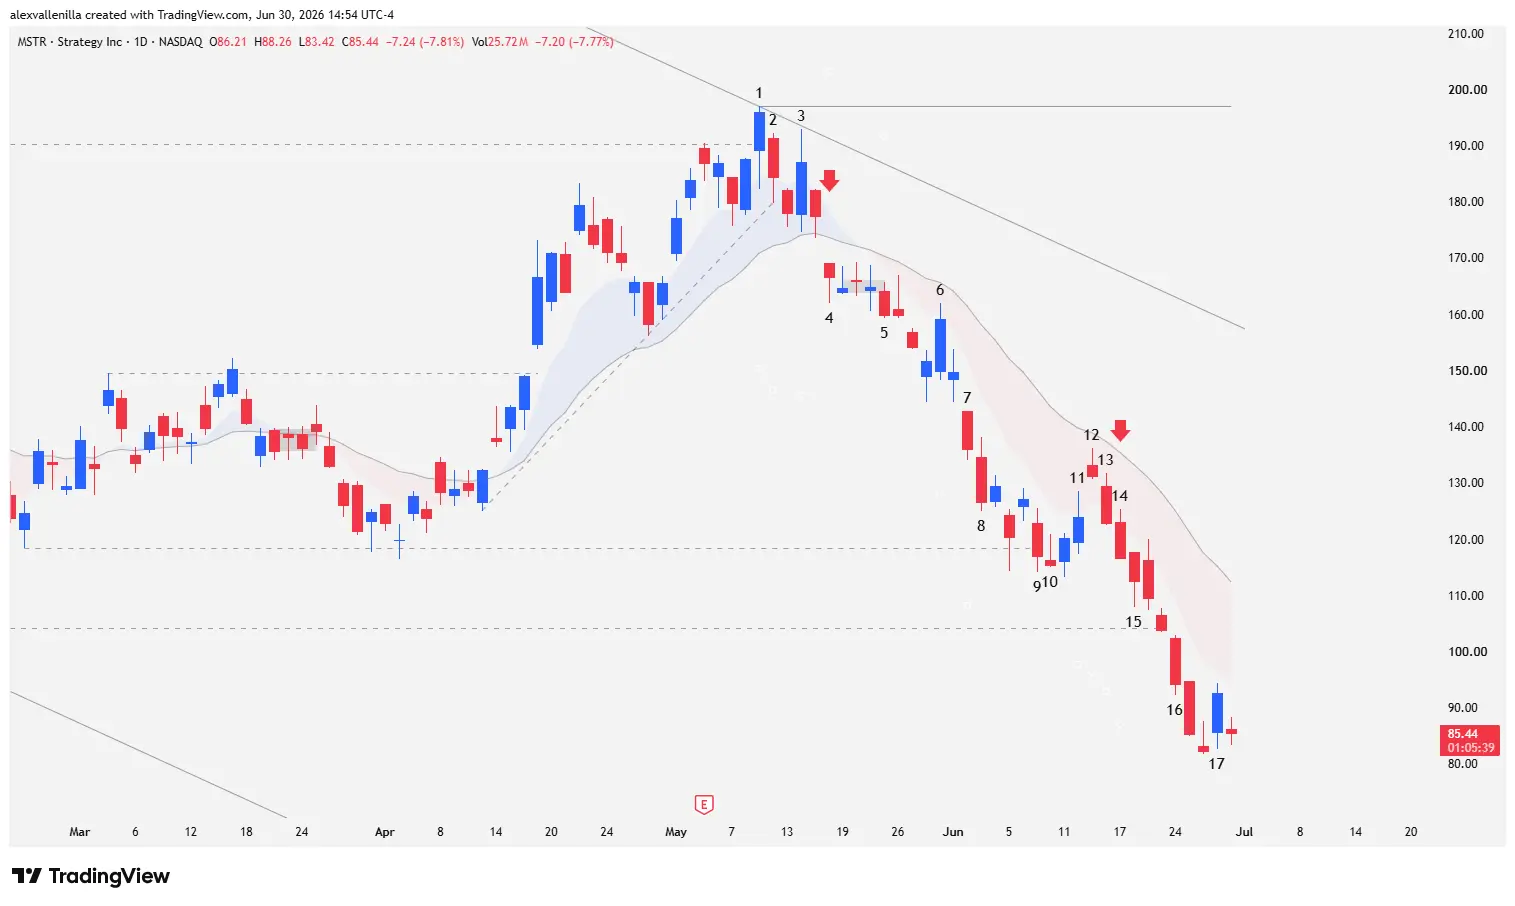
Bar 1 initially broke through the $190.20 resistance (the last relevant lower high of the previous bearish impulse). However, buyers failed to sustain the move. This session’s high established a ceiling at $197, a level that served as an anchor to plot a new long-term downtrend line.
Technically, Bar 1 acted as an EMA gap bar (a bar with room between its price and the 20-period Exponential Moving Average). In dominant bearish environments, extended rallies above the 20 EMA that fail to consolidate key levels constitute highly reliable sell signals under the “sell the rally” premise. Bar 2 confirmed this scenario by denying any bullish continuity.
Detailed Technical Analysis: Bar-by-Bar Order Flow
The MicroStrategy collapse unfolded through a sequence of candlestick patterns that systematically invalidated buying pressure.
Bar 3 (Outside Volatility): Bulls attempted to find support at the 20 EMA, creating an outside bar. However, the volatility liquidated both directions and printed a lower high relative to Bar 1. The subsequent lack of confirmation validated a reversal failure.
Bar 4 (Low 2 Sell Trigger): This session decisively pierced the 20 EMA to the downside, establishing a high-probability Low 2 short setup (the second failed attempt to resume the bullish move). Following this bar, price congested for three sessions; the short sell order formally triggered on the third bar of this pause when the low of Bar 4 was breached.
Bars 5 and 6 (Counter-Trend Failure): Bar 5 expanded the range downward, breaking the congestion. After a failed buying attempt, Bar 6 printed a strong bullish range. However, buyers exhibited institutional weakness: the high failed to even test the 20 EMA, and the following session lacked follow-through, trapping long traders.
Bars 7 and 8 (Momentum Acceleration): Bar 7 validated the drop by trading below the previous low, while Bar 8 extended losses. Subsequent efforts by buyers to stabilize the price quickly capitulated.
Loss of Critical Zones: A Trip Back in Financial Time
The loss of historical support levels alters the asset’s medium-term structure, invalidating the previous accumulation.
The $118.4 Breakout
Bar 9 consolidated a bearish milestone by breaking the $118.4 support, the lower bound of the sideways range built during the previous downtrend’s pause. Losing this level marked the definitive failure of the bulls’ attempt to reverse the macro structure. Bar 10 offered an inside pause that merely accumulated sell orders.
Continuous Continuation Structure
Bars 11, 12, and 13 staged another market deception. Buyers looked for a reversal, but Bar 12 closed with a bearish profile, leaving an internal gap and failing once again to test the 20 EMA. Bar 13 confirmed the drop by closing below its predecessor.
Consequently, Bar 14 turned into another Low 2 setup in favor of the primary trend, which was immediately triggered by Bar 15.
Structural Destination: Target at $46.75
The Bar 16 session solidly pierced the critical support at $104.17, which represented the last structural lower low of the primary downtrend. This technical move confirms the formal resumption of the major downtrend.
Even though Bar 17 temporarily interrupted the decline via a counter-trend bounce (printing a higher low and higher high), this move only indicates the completion of the second legs down from the $197 area. Measured move analysis projects deeper targets.
Losing $104.17 clears the technical path to target the next highly relevant macro support located at $46.75. This key liquidity zone has not been tested in over 600 bars, remaining untouched since February 7, 2024. The price’s persistent inability to touch the 20 EMA over the last 29 sessions confirms the extreme strength of the current sell order flow.
Disclaimer: This analysis is provided exclusively for informational and educational purposes based on price action methodology. It does not constitute, nor should it be interpreted as, financial advice, or a recommendation to buy or sell fixed assets, stocks, or securities. Trading equities and technological instruments carries a high risk of capital loss.
Communications Professional. Crypto Enthusiast. Economic Journalist. Bitcoiner & Altcoiner.