The crypto ecosystem is heating up in this second quarter of 2026, and NEAR Protocol (NEAR) is leading the charge with an impeccable display of technical strength. After consolidating an accumulation structure for months, aggressive institutional order flow stepped in to catapult the price above critical resistance levels. With a year-to-date return of 74.24% in 2026 and an impressive 94.26% over the last three months, NEAR is shaking off its dormant behavior. The price pierced through resistance at $1.89, shifting market dynamics from bearish to heavily bullish and opening the door for a 2-legged parabolic move looking to sweep buy-side liquidity at higher levels.
Channel Breakouts and Institutional Order Flow
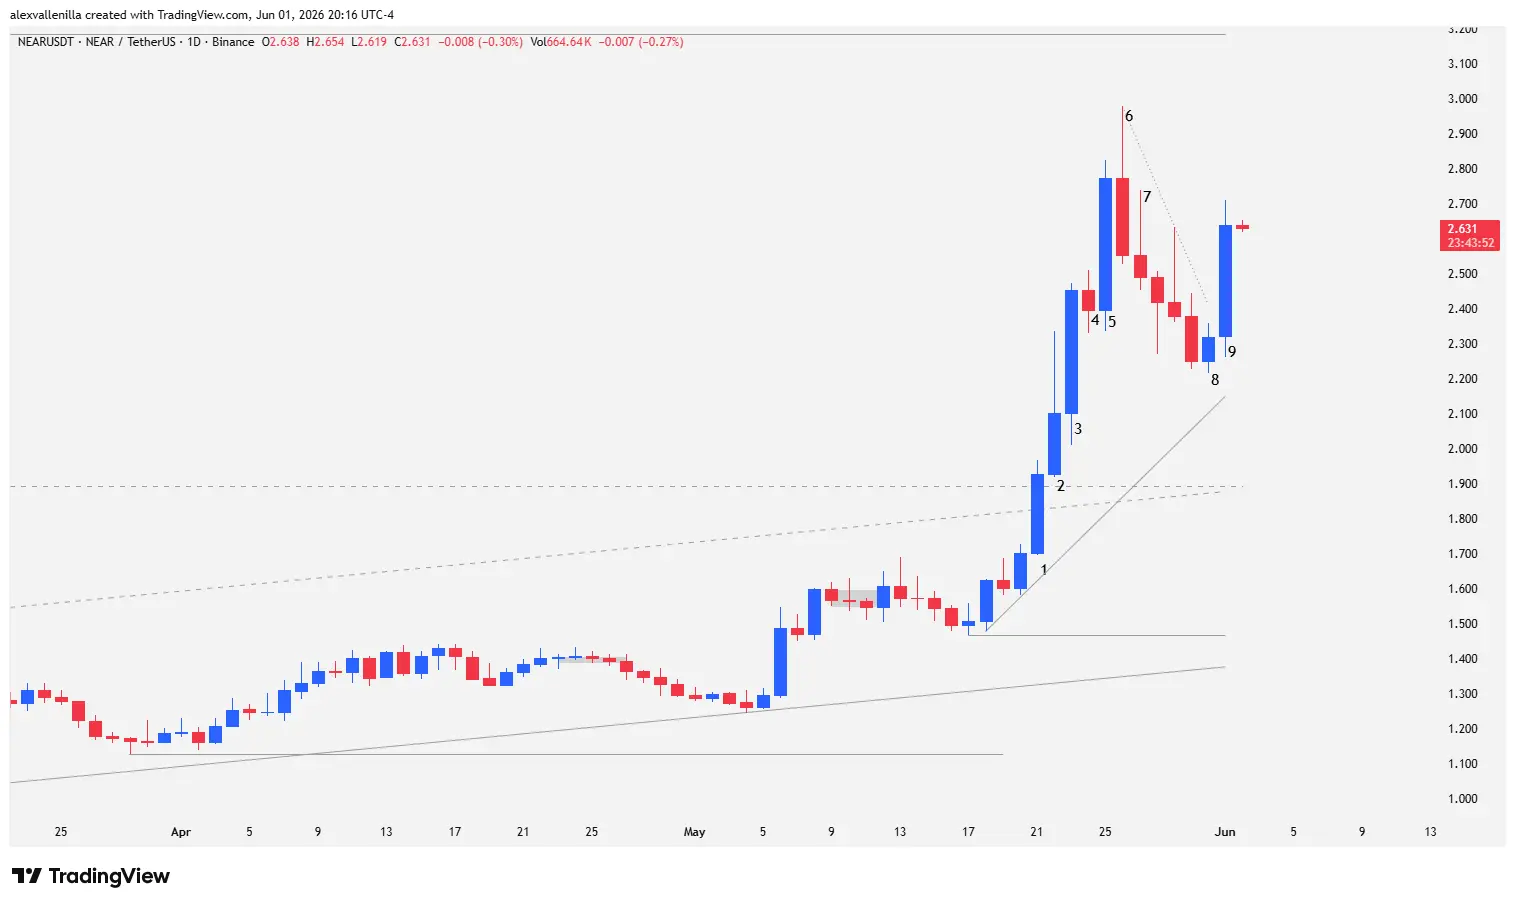
NEAR Protocol’s macro context reflects a textbook structural transition. The asset remained trapped in a minor downtrend for 109 bars, whose point of control and peak sits at $3.18. However, market participant psychology shifted drastically during the subsequent 115 bars. Throughout this period, NEAR carved out an ascending channel characterized by a consecutive series of higher lows, signaling a quiet but persistent accumulation by “smart money.”
The real acceleration occurred when buy order flow overwhelmed available supply at the top of the channel. This breakout does not represent a fleeting retail move; it constitutes an injection of institutional capital looking to expand the price toward the next major liquidity pool at $8.25, which defends the macro downtrend.
Candle Scanner: Bar-by-Bar Price Action Anatomy
To understand market psychology and complete buyer dominance, we must dissect the recent sessions using pure Price Action methodology.
Bars 1 to 3: Liquidity Injection and Breakout Confirmation
Bar 1 (Breakout Marubozu): Bulls printed a wide-range candle with extremely high conviction. Lacking a lower wick (shaven bottom), it proves that buy orders flooded the market right from the opening price. This bar violently pierced the key $1.89 resistance and the ceiling of the 115-day ascending channel, simultaneously breaking the structure of the previous minor downtrend.
Bar 2 (Support Validation): This session functioned as a supply test. Although bears attempted to manufacture a bull trap by pushing the price down and leaving a massive upper wick (larger than the body), they failed to force price back into the channel. Buyers successfully defended $1.89, flipping the old resistance into a solid structural support.
Bar 3 (Exponential Expansion): Smart money erased any lingering doubt. Registering a massive 16.65% rally, this candle closed firmly above the high of Bar 2. Exhibiting a minimal upper wick, it confirmed clean bullish continuation and stood as the highest conviction bar since the cycle began, completely trapping short sellers.
Bars 4 and 5: Climactic Exhaustion at the Peak
Bar 4 (Weak Pullback): A tiny bearish candle that served as a healthy pause. The narrow range of this bar highlighted a complete absence of selling pressure at these levels.
Bar 5 (Buying Climax): Bulls resumed the attack with another explosive 15.74% candle, invalidating the previous bearish fakeout. However, its structure raised risk alarms: its body size substantially exceeded all previous bars in the impulse. This climactic and parabolic condition increased volatility, warning of imminent buyer exhaustion before a profit-taking pullback.
Bars 6 to 9: The Bull’s Rest and the Bear Trap
Bar 6 (Profit Taking): Although it printed a higher high, distribution pressure emerged. Sellers aggressively stepped in to take profits, forcing a close below the midpoint of Bar 5 and leaving a noticeable upper wick. Price halted just before testing the $3.18 resistance, confirming temporary exhaustion of the first impulse.
Bar 7 (Bearish Continuation Pinbar): This candle closed below the low of Bar 6, validating the correction. Nonetheless, small candle bodies revealed that bears lacked the necessary strength to initiate a real trend reversal.
Bar 8 (Narrow Pivot Point): After four consecutive sessions of a bearish drift, this small bullish candle stopped the bleeding. Low volatility and an abundance of wicks in the preceding days proved that the pullback lacked institutional conviction.
Bar 9 (Reversal and Bear Trap): Institutional money reappeared with force, printing a wide-range 13.75% candle. By establishing a higher low relative to Bar 8, bulls defended their territory. This powerful reversal candle broke the bearish micro-channel, trapped late sellers from Bar 8, and restored the heavily bullish market bias.
Technical Projections: The Two-Legged Approach
From a strict price action perspective, clean, parabolic moves (like the one observed between Bars 1 and 5) rarely conclude with a single impulse. The market tends to move in symmetrical 2-legged structures.
Under this framework, the pullback between Bar 6 and Bar 8 does not represent a trend reversal, but rather a transitory resting zone or market breather. By taking the length of the first bullish leg and projecting it from the low of Bar 9, order flow defines a theoretical technical target in the $3.54 zone for the coming sessions.
To cement a long-term bull market, NEAR must pierce the technical and psychological resistance at $3.18. A sustained close and subsequent consolidation above this level will confirm a definitive cycle change, leaving a clear path toward the next major macro point of control at $8.25. Should unexpected exhaustion appear, buyers have key buffers: the 14-bar dynamic acceleration support at $2.14 and the insurmountable institutional wall at $1.89.
Disclaimer: This analysis is presented for informational and educational purposes only. It does not constitute, nor should it be interpreted as, investment advice, financial advice, or a recommendation to buy or sell digital assets. Crypto assets exhibit extremely high volatility; only risk capital you are willing to lose.
Communications Professional. Crypto Enthusiast. Economic Journalist. Bitcoiner & Altcoiner.