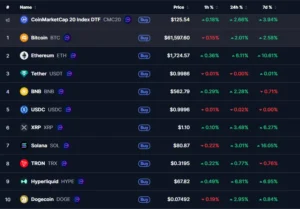
The digital finance market grants no concessions based on the renown of its founders. Worldcoin (WLD), the ambitious digital identity project co-founded by Sam Altman, currently trades above $0.41, registering a modest partial gain of 3.44% for the session. However, this breather arrives after a severe technical correction. Bulls recently capitulated after failing to validate a breakout above macro resistance at $0.6539, a critical level that represented the last major lower high of its long-term downtrend. The rejection in this zone triggered a wave of sell orders that dragged the price into a deep correction within a narrow channel, testing the conviction of medium-term buyers.
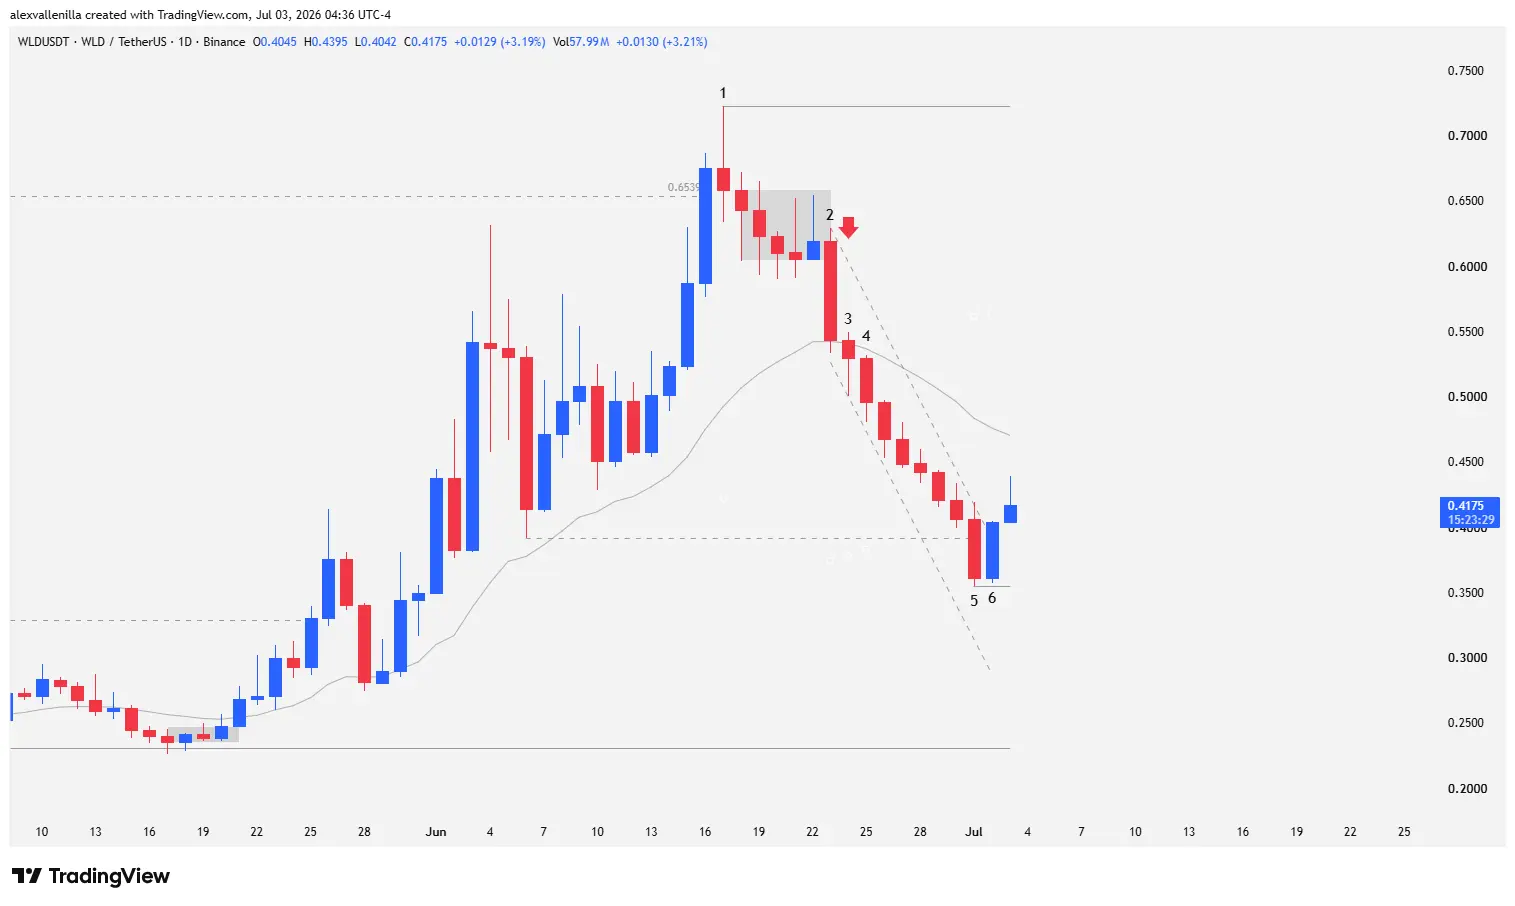
Price Action Diagnosis: Anatomy of a Capitulation
To understand Worldcoin’s current market structure, we must block out the noise and focus purely on the psychology of price action reflected in its most recent candlesticks.
Bars 1 to 3: The end of the two-legged pullback and the loss of the 20 EMA
Bar 1 (Resistance Trap): Price prints a bearish pinbar (rejection pinbar) right at the culmination of a two-legged bullish move. This candlestick appears as a buying climax at the top of the trend, attracting institutional sellers due to obvious buyer exhaustion. By failing to confirm a breakout above $0.6539, Bar 1 turns into a failed breakout. The subsequent session confirms the reversal with a lower high and lower low, trapping price in a tight five-session trading range (“barbed wire”).
Bar 2 (The first crack): This candlestick breaks sharply below the base of the horizontal congestion, executing the first test of the 20-period Exponential Moving Average (20 EMA). Price had accumulated 23 consecutive bars without touching this average—a metric highlighting the verticality of the previous rally, but one that made this retest an undeniable sign of structural fatigue.
Bar 3 (Reversal confirmation and “Low 2” trigger): Bears secure a solid close below the 20 EMA. This technical milestone officially buries the previous bullish momentum. In addition to confirming the failed major trend change, Bar 3 triggers a Low 2 short setup (a second failed attempt to resume the uptrend), leaving bears firmly in control below the dynamic moving average.
Bars 4 to 6: Bear breakout and defense at the lows
Bar 4 (Bearish acceleration): The low of this bar pierces the floor of Bar 3, triggering market sell stop orders. Lacking significant buying counterpressure, price slides rapidly through a steep, narrow downtrend channel, cementing a deep, uninhibited correction.
Bar 5 (Control breach and new floor): Selling pressure breaks local support at $0.3916, a vital pivot point from the previous uptrend channel. However, bears grind to a halt after printing a low at $0.3552.
Bar 6 (Stalling and internal reversal): This prints as a bullish inside bar. The candlestick halts the bleeding and sets up a reversal structure by strictly respecting support at $0.3552. A key technical factor stands out here: the low of Bar 5 sits significantly above macro support at $0.2311 (the ultimate absolute low of the previous downtrend), proving that buyers are willing to step in at higher prices. Furthermore, Bar 6 manages to close outside the upper boundary of the mini downtrend channel.
Macro Outlook and Technical Scenarios
The current daily candlestick is testing the 20 EMA, temporarily confirming the Bar 6 reversal by printing a higher high. The behavior of the upcoming daily closes will determine WLD’s path under two mathematical and order-flow scenarios:
Bullish Scenario: Reclaiming the 20 EMA
To invalidate the current correction, demand must push price above the 20 EMA, which currently acts as dynamic resistance at $0.4706. A sustained close above this level would force bears to cover their positions, opening the door to target the high of Bar 3 and eventually shifting institutional order flow for a second run at the Bar 1 high at $0.7229.
Bearish Scenario: The Magnet at $0.2311
If the 20 EMA rejects the current price and bears reclaim control, the first technical stop rests at recent support around $0.3552. Losing this zone would confirm that the current bounce is merely a relief rally in a bear market, opening the gates to retest critical, historical trend support at $0.2311.
On a macro level, Worldcoin’s performance reflects the typical volatility of an asset in a trend-reversal phase: while it shows a positive return of 56.74% over the last three months and 9.10% over the past month, the long-term chart reveals deep scars, posting losses of 55.78% over the last 12 months and 13.17% year-to-date. The current technical structure is not dead, but it demands strict institutional caution.
Disclaimer: The information presented in this article does not constitute financial advice, investment recommendations, or formal analysis for operational decision-making. Crypto assets exhibit high volatility; perform your own due diligence before risking capital.
Communications Professional. Crypto Enthusiast. Economic Journalist. Bitcoiner & Altcoiner.