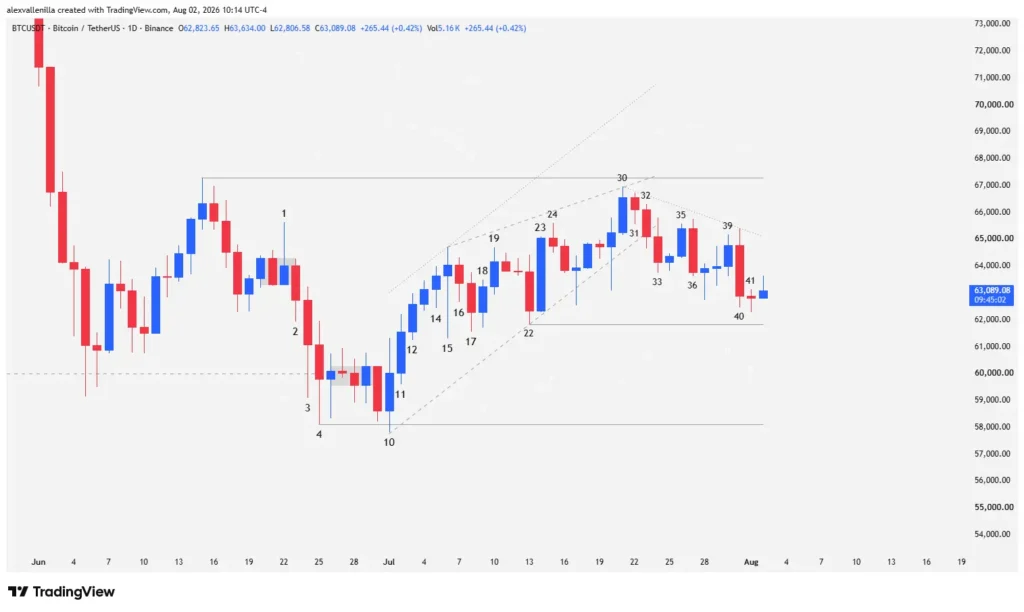
The price of bitcoin (BTC) on its daily chart goes through a phase of high technical tension after concluding a 23-bar bull run that fails to break the $67,292 resistance. During recent sessions, bounded between bars 30 and 41, the price action shows a bearish compression structure with lower highs, though the lack of selling follow-through suggests an absorption stage and potential accumulation at current levels.
The End of the Bull Run and the Wedge Trap
Market dynamics begin to shift when bar 30 marks the exhaustion of a bounce following a bull flag formed at a double bottom (linked to the lows of bars 4 and 10). Buyers lose momentum by failing to reach the $67,292 resistance zone, shaping an ascending wedge that exposes demand weakness and triggers the green light for sellers to take control.
Structural Breakdown and Downward Pressure
The breakout materializes on bar 33, confirming the loss of the previous bullish structure following the pullback starting on bar 31 and the channel line break of bar 32. Although bears strike hard on bar 36—a high-conviction outside bar—and repeat the dose with an aggressive wide-range bar 40, the absence of immediate bearish follow-through on bar 41 reflects indecision and marked absorption by institutional hands.
Technical Analysis (Top Priority)
Rigorous price action analysis breaks down the current battle on the bitcoin daily chart:
Exhaustion at Bar 30: The price reaches a high that fails to test key resistance at $67,292, slowing down the momentum of the previous 23 bars and drawing the upper boundary of an ascending wedge.
Failure and Breakout (Bars 31-33): Bar 31 acts as an inside bar trapping late buyers. Bar 32 pierces the bull channel, and bar 33 confirms the structural breakdown with increased volatility and two-way tails.
Bullish Feint and Bearish Reversal (Bars 35-36): Bulls attempt a two-bar reversal on bar 35 after a consolidation, but bar 36 answers with a powerful bearish outside bar that traps early bulls.
Demand Inconsistency (Bar 39): Three low-conviction bars attempt a bounce that culminates in bar 39, whose lower high relative to bar 36 and bar 30 seals a new downward trendline.
Institutional Strike and Compression (Bars 40-41): Bar 40 prints a strong bearish wide-range candle, compressing prices against the support of the bar 22 low. However, bar 41 prints a doji without bearish follow-through, unable to reach local support at $61,824 (the control point of the broken bullish trendline).
The macro scenario reveals an underlying downtrend showing clear signs of deceleration. If bears breach the bar 22 low support, the path opens toward a test at $58,115. Conversely, if the support zone holds, buyers will attempt to structure a new trading range bounded by the $67,292 resistance.
The current bitcoin price compression on the daily chart demonstrates that the market digests supply with caution. Monitoring price reactions to critical supports determines whether we face a simple pause within the correction or the prelude to a broader sideways consolidation.
Disclaimer: This analysis serves educational and informational purposes exclusively and does not constitute financial or investment advice. The cryptoasset market carries high risks; trade at your own risk.

Communications Professional. Crypto Enthusiast. Economic Journalist. Bitcoiner & Altcoiner.