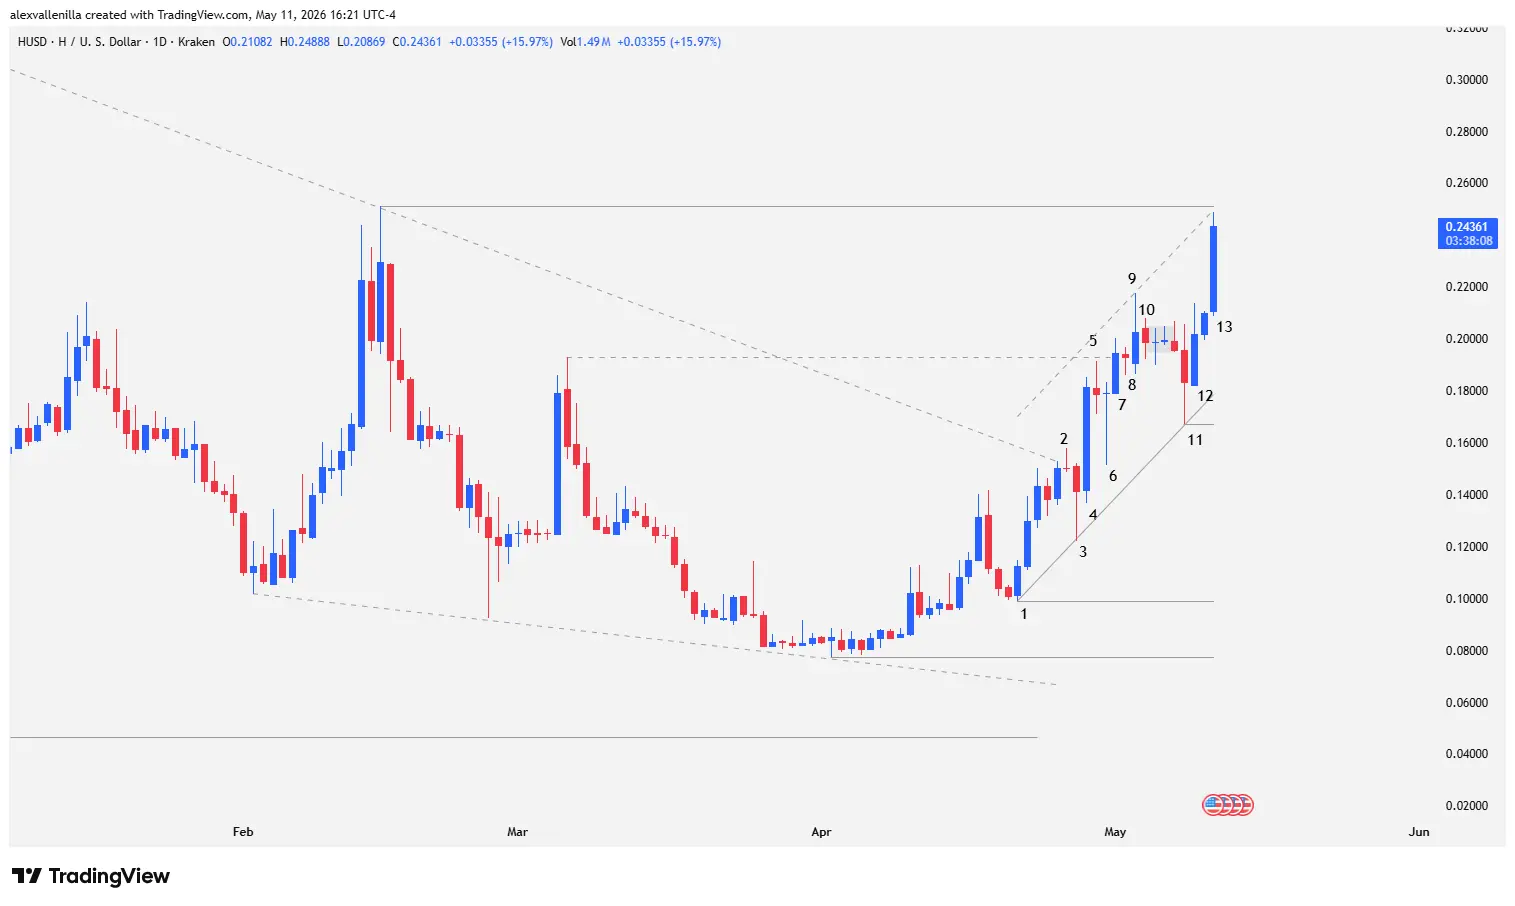
H has achieved the seemingly impossible after 183 days of stagnation: breaking its primary bearish trend. Through a “two-legged” bullish structure and flawless supply absorption, the asset climbed to $0.2436 today, marking a 15.97% intraday gain and positioning itself to definitively invalidate seller control.
From Trap to Liberation: Ending 183 Bars of Decline
H’s daily chart tells a story of resilience. Following a prolonged downtrend, price action generated a bull trap that appeared to seal the asset’s fate. However, Bar 1 marked a decisive higher low, igniting a counter-trend that has now become a structural reality.
The official breakout arrived with Bar 2, a prominent upper-wick doji that, despite its lack of body, managed to pierce the 183-bar downtrend line. What followed was a masterclass in market psychology: bears attempted to regain control at Bar 3 but hit a wall of buyers who printed a pin bar with a tail doubling its body—a clear signal of supply absorption.
Technical Analysis: Anatomy of the Impulse (Bars 4 to 13)
The current movement consists of two “legs” of strength, where bullish efficiency contrasts sharply with the weakness of the corrections.
Confirmation of Strength (Bar 4): This session was the turning point. With a forceful 28.26% surge, this “efficient effort” bar confirmed the trendline break and surged past Bar 2 highs without hesitation.
Channel Resilience (Bars 6 to 8): Following a reversal attempt at Bar 5, Bar 6 (a dragonfly doji) proved buyers were ready to defend the new dynamic support. Bar 7 validated this reversal failure by closing above the critical $0.1931 resistance.
The Barbwire and the Second Leg (Bars 9 to 12): Price entered a technical congestion phase (barbwire pattern) between bars 9 and 11. Bears applied maximum pressure at Bar 11 but failed again, leaving a long lower tail that supported the 20-bar channel trendline. Bar 12 responded with a 10.09% jump, invalidating bearish control.
The Current Scenario: Assaulting $0.2511
We reach Bar 13 (the current session). The price trades at $0.2436 and seeks to test the $0.2511 resistance—the last major bastion of the previous downtrend.
The technical narrative is potent: while bearish bars show tiny bodies and long tails (low efficiency), bullish bars (4, 12, and 13) are solid and wide-ranging. If H consolidates above $0.2511, the bearish structure becomes fully invalidated, opening the door to a long-term bull cycle. Should it fail, dynamic support awaits at $0.1784.
Disclaimer: This analysis is for informational and educational purposes only. Cryptocurrency trading involves significant risk. It does not constitute financial advice; perform your own research before investing.
Communications Professional. Crypto Enthusiast. Economic Journalist. Bitcoiner & Altcoiner.