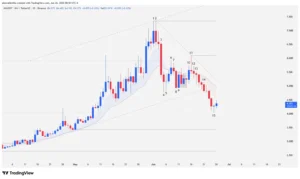
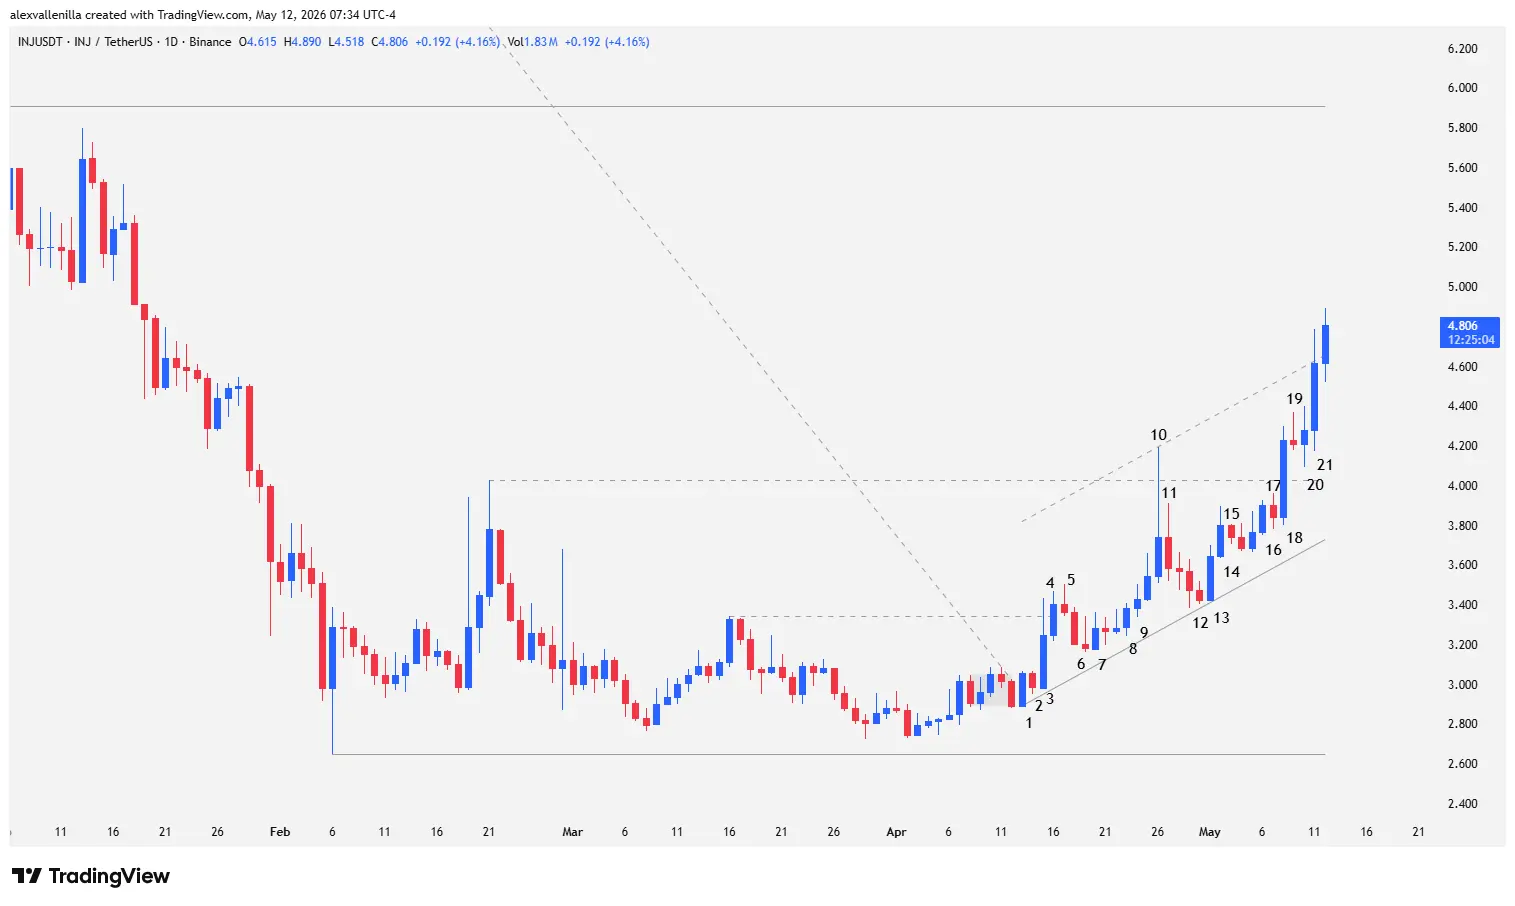
Injective (INJ) executed a highly significant technical move by breaking a downtrend line that dominated the chart for 760 bars. After consolidating critical support levels, the asset successfully invalidated bearish reversal patterns (such as tweezers and pinbars) to position itself in a “spike and channel” phase. Currently, INJ is trading around $4.80, accumulating an intraday gain of 4.16% and projecting targets toward levels not seen in months.
Bullish Renaissance: From Consolidation to Momentum
The Injective market shifted from low volatility and price overlapping to a structure of higher highs and higher lows. Surpassing the congestion zone between $2.65 and $3.34 marked the beginning of this shift in sentiment. Despite sellers’ attempts to regain control, demand resilience at the breakout levels transformed former resistances into operational supports.
The current narrative suggests a long-term structural change. Price did not only exit the tight range but also pierced the psychological resistance at $4.02, validating a bullish channel that has already developed over 29 bars.
Technical Analysis: Anatomy of the Breakout (Bars 1-21)
To understand the strength of the move, it is imperative to break down the price action by numbering its key bars:
Bar 1: Initiates the move with a solid bullish candle that breaks the 760-bar downtrend and the previous congestion range.
Bars 2 and 3: In Bar 2, bears attempt a tweezer top, but the failure of this formation in Bar 3 (which rallied 8.81%) trapped sellers, confirming the technical breakout.
Bars 4 and 5: Bar 4 closes above the $3.34 resistance. Although Bar 5 (a bearish pinbar) threatened a reversal, support held firm.
Bars 8 to 10: A buy signal (High 2) is triggered at Bar 8. Bar 10 injects high volatility with a 5.50% close, piercing $4.02, though a top wick reveals selling pressure.
Bars 11 to 13: Following a healthy technical correction (Bars 11 and 12), Bar 13 acts as a fundamental pivot, establishing the trendline for the new ascending channel.
Bars 16 to 18: Price formed an ascending triangle compressing against $4.02. Bar 18 was the definitive hammer blow: a 10.07% advance that broke resistance cleanly and efficiently.
Bar 21 and Current: Bar 21 rose 7.78%, attempting an overshooting of the channel’s upper bound. The current price of $4.80 confirms that bulls remain at the helm.
Projections: The Path to $5.90
Measured move analysis following the local resistance breakout places an immediate technical target at $5.38. However, the true litmus test lies at $5.90, a level representing the last relevant high of the macro downtrend.
If INJ manages to consolidate above this point, we would be looking at a “V-shaped” reversal that could attract massive institutional and retail capital. Conversely, should a retracement occur, $4.02 now serves as the most critical floor to keep the bullish thesis alive.
Disclaimer: This analysis is for informational and educational purposes only. It does not constitute financial advice or investment recommendations. Cryptocurrency trading carries a high risk of capital loss.
Communications Professional. Crypto Enthusiast. Economic Journalist. Bitcoiner & Altcoiner.