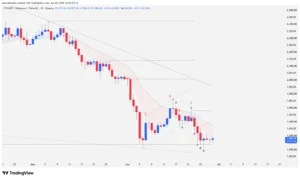
Bitcoin (BTC) price action on the 1D daily chart reveals a fierce battle between bulls and bears. After a solid 43-bar recovery that structured a two-legged bull cycle from psychological support at $60,000, the flagship crypto asset currently trades at $80,586 with a minor 0.62% contraction. The market is compressing within a rising wedge against the ceiling of a 98-bar ascending channel—a high-tension technical pattern that anticipates an explosive medium-term move.
The Anatomy of Compression: Price vs. Channel Ceiling
After breaking a prior 189-bar downtext, buyers seized institutional control, but momentum is starting to show signs of technical fatigue. Price action is trapped in a rising wedge. This structure compresses higher lows against a fixed resistance at the $82,850 high and the upper line of the 98-bar ascending channel.
The market is debating whether this rally validates a new macro cycle or sets a sophisticated bull trap, considering price still trades below the most relevant macro resistance at $97,950.
Detailed Technical Analysis: A Radiograph of the Last 9 Bars
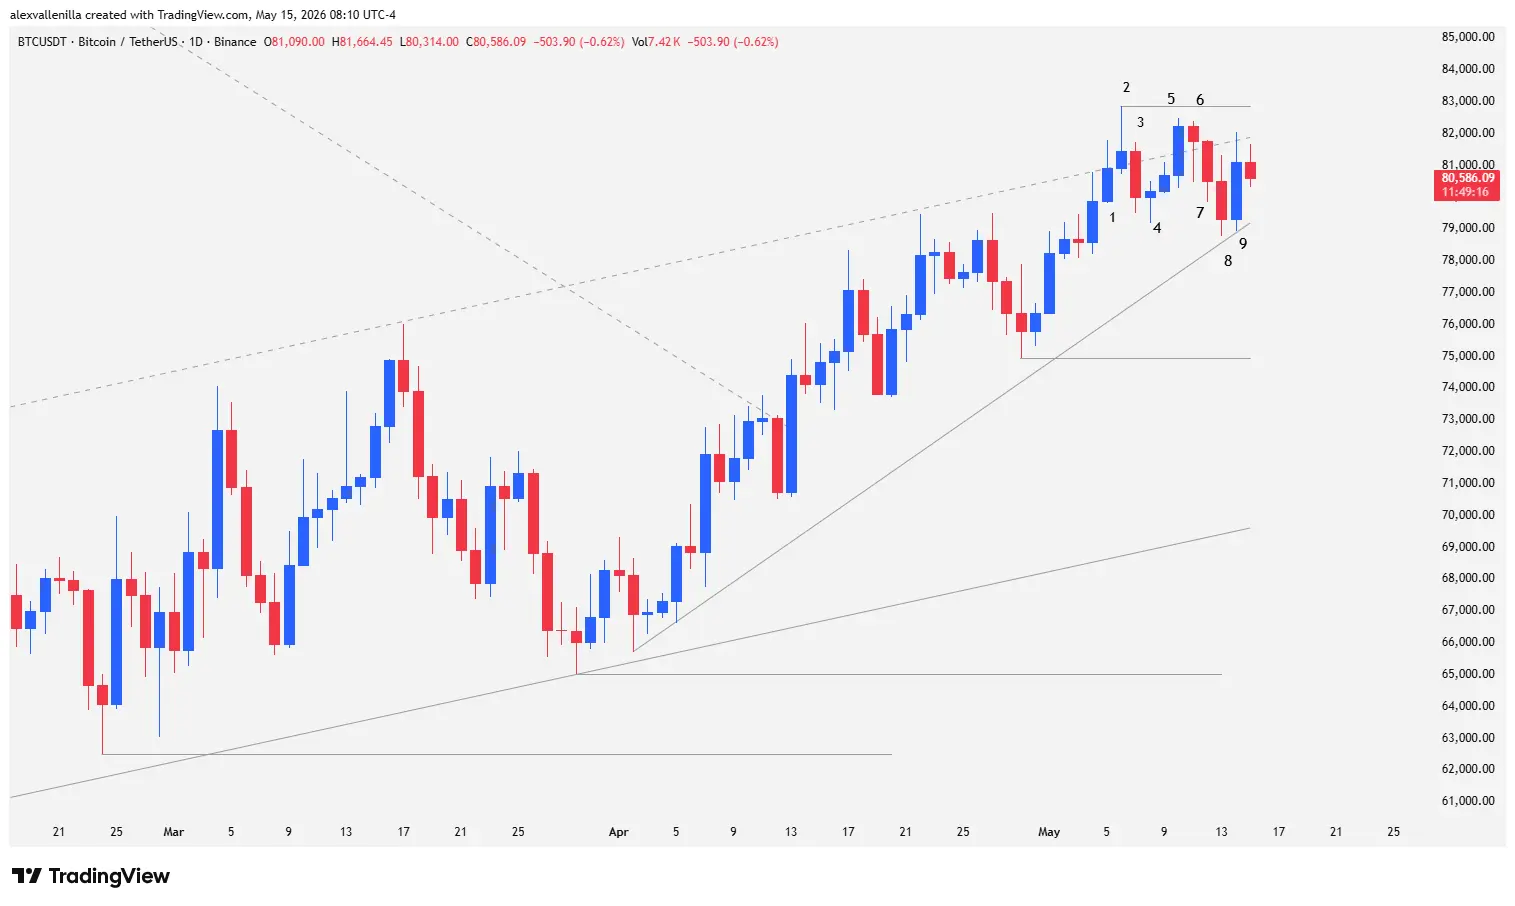
To understand which way the price will break, we must break down the narrative that professional traders have printed on the daily chart across the last 9 sessions:
Bar 1: A moderate-range bullish candle tried to accelerate price and break the upper side of the channel. However, sellers defended the zone, forcing a close below the dynamic line and leaving an upper tail that matched the body size.
Bar 2: Bulls maintained pressure and forced a close above the channel. However, heavy selling activity generated a pin bar with an upper wick twice the size of the body. The high of this bar established key fixed resistance at $82,850, showing a lack of follow-through.
Bar 3: A narrow-range bearish reversal bar. Its close sat below the low of Bar 2, pushing price back inside the channel, albeit with low volatility.
Bar 4: A new pin bar with a bullish close and a microscopic body. By closing above the low of Bar 3, it triggered a bearish follow-through failure.
Bar 5: A new buying impulse broke the dynamic channel resistance with moderate conviction, but the candle body was not large. The fact that its high failed to test $82,850 (Bar 2 High) left a technical vacuum, signaling exhaustion in bullish momentum.
Bar 6: An inside bar of consolidation. Failing to provide follow-through to the Bar 5 breakout, it confirmed exhaustion ahead of the $82,850 resistance. This marked the second failed attempt to accelerate price.
Bar 7: A bearish candle that validated the sideways consolidation. Although it pierced the low of Bar 6, the close stayed within its range, failing to trigger an immediate drop.
Bar 8: Bearish follow-through with a close below the low of Bar 7. Structurally, this set up a Low 2 sell signal. In a micro context, it suggested downside risk; however, because it operated against the 98-bar ascending channel, the probability of success for the bears decreased.
Bar 9: This candle completely invalidated the prior bearish narrative. Its low defended the zone without triggering the Bar 8 sell order, and its high cleared the top of the previous session, invalidating the Low 2. Technically, the failure of a Low 2 pattern in a bullish context acts as a powerful buy signal. The low of this bar also served to plot the lower trendline of the rising wedge.
Projected Scenarios: Targets and Liquidation Zones
The market is storing tremendous energy due to this asymmetric compression. Geometrically, price has only two ways out:
Bullish Scenario: Toward the New Macro Cycle
If buying volume validates the Low 2 failure and aggressively pierces the confluence of dynamic resistance and the Bar 2 high ($82,850), it will trigger a measured move. The primary technical target would catapult bitcoin past $95,000, opening the door to challenge key resistance at $97,950. Consolidating that zone would officially confirm a new medium- and long-term bull cycle.
Bearish Scenario: The Wedge Capitulation
If bulls show fatigue again at $82,850, the rising wedge structure will break to the downside. Price will first seek intermediate fixed support at $75,000. If it loses this zone, the bearish target shifts to the base of the 98-bar channel, currently located at dynamic support around $69,600.
Although the latest candles structurally favor buyers, prudence rules: trading inside a rising wedge near local highs demands razor-sharp risk management due to the high risk of a leverage wipeout.
Communications Professional. Crypto Enthusiast. Economic Journalist. Bitcoiner & Altcoiner.